Amazon.com
Amazon.com, Inc.
Company highlights
A company where the fee is a doorway rather than a source of earnings.
Vol.4, Chapter 1 (as of 2026-08-22)
Key figures
Period to 2025-12-31ConsolidatedU.S. GAAP
Business revenue model
Featured in
Vol.4, Chapter 1 (as of 2026-08-22)
“Kaisha no Shikumi: Subscriptions”, Chapter 1: Costco and Amazon Prime: The Same Annual Fee, Compared in the Filings
Book’s reference date 2026-08-22 / data last checked 2026-10-20
Key points in this volumeA subscription business's profits cannot be judged by member count alone.
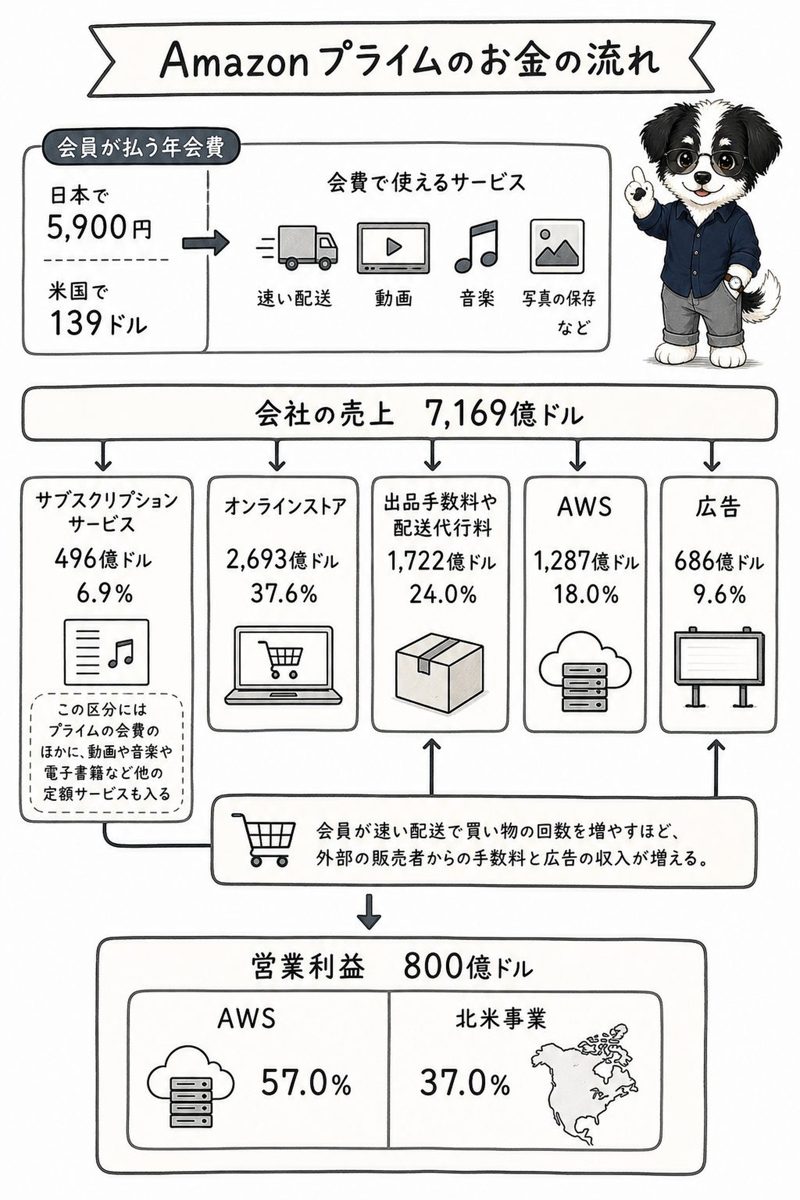
The annual fee for Amazon Prime is ¥5,900. Yet the segment that includes fees stays at 6.9% of total sales.
Where Costco earns on the fee itself, this company places the fee at the entrance to an economy. What is large in the accounts is the commission it receives from third-party sellers.
Coverage in the book
- What Is the Amazon Prime Fee For?
- Amazon's Ten Fiscal Years, and No Dividend
- The Same Annual Fee, Treated Differently in the Accounts
Related books, articles and videos
 “Kaisha no Shikumi: Subscriptions”
Chapter 1: Amazon.com
“Costco and Amazon Prime: The Same Annual Fee, Compared in the Filings”
“Ano Kaisha no Shikumi” series, Vol.4 — Kindle and paperback
Find it on Amazon →


Company profile
Tables scroll sideways
Disclosed data
Business activities and revenue composition
Breakdown by business: not published
Revenue and profit
Performance, financial position and capital allocation
Amazon.com
Recent performance trends
Source Annual securities reports
Consolidated indicators (6 items)
| Item | 4 years ago | 3 years ago | 2 years ago | Last year | This year |
|---|---|---|---|---|---|
| Net sales | US$469.8 billion | US$514.0 billion | US$574.8 billion | US$638.0 billion | US$716.9 billion |
| Operating income | US$24.9 billion | US$12.2 billion | US$36.9 billion | US$68.6 billion | US$80.0 billion |
| Net income | US$33.4 billion | US$-2.7 billion | US$30.4 billion | US$59.2 billion | US$77.7 billion |
| Net cash provided by (used in) operating activities | US$46.3 billion | US$46.8 billion | US$84.9 billion | US$115.9 billion | US$139.5 billion |
| Total assets | US$420.5 billion | US$462.7 billion | US$527.9 billion | US$624.9 billion | US$818.0 billion |
| Net assets | US$138.2 billion | US$146.0 billion | US$201.9 billion | US$286.0 billion | US$411.1 billion |
Revenue scale in the same industry
Companies in the same industry with disclosed revenue: 2 (no comparison)
Sources and methodology
Basic indicators
| Item | Value | Consolidated / Non-consolidated | Source |
|---|---|---|---|
| Net sales | US$716.9 billion | Disclosed | |
| Operating income | US$80.0 billion | Disclosed | |
| Net income | US$77.7 billion | Disclosed | |
| Net cash provided by (used in) operating activities | US$139.5 billion | Disclosed | |
| Total assets | US$818.0 billion | Disclosed | |
| Net assets | US$411.1 billion | Disclosed | |
| Operating margin | 11.2% | Consolidated | Calculated |
| Net assets to total assets | 50.2% | Consolidated | Calculated |
| Net margin | 10.8% | Consolidated | Calculated |
| Return on equity | 18.9% | Consolidated | Calculated |