Nintendo
Nintendo Co., Ltd.
Company highlights
A company that makes its own hardware and software and sells the finished product.
Vol.9, Chapter 1 (as of 2026-09-11)
Key figures
Period Apr 2025 to Mar 2026ConsolidatedJapanese GAAP
Business revenue model
Featured in
Vol.9, Chapter 1 (as of 2026-09-11)
“Kaisha no Shikumi: Selling the Same Hit Again and Again”, Chapter 1: Nintendo and Sanrio: One Sells the Finished Product Itself, the Other Has Others Make It and Collects a Fee
Book’s reference date 2026-09-11 / data last checked 2026-10-20
Key points in this volumeThe long-term profits from a hit depend not just on its initial success, but on how long it keeps earning, how many forms it takes, and how many markets it reaches.
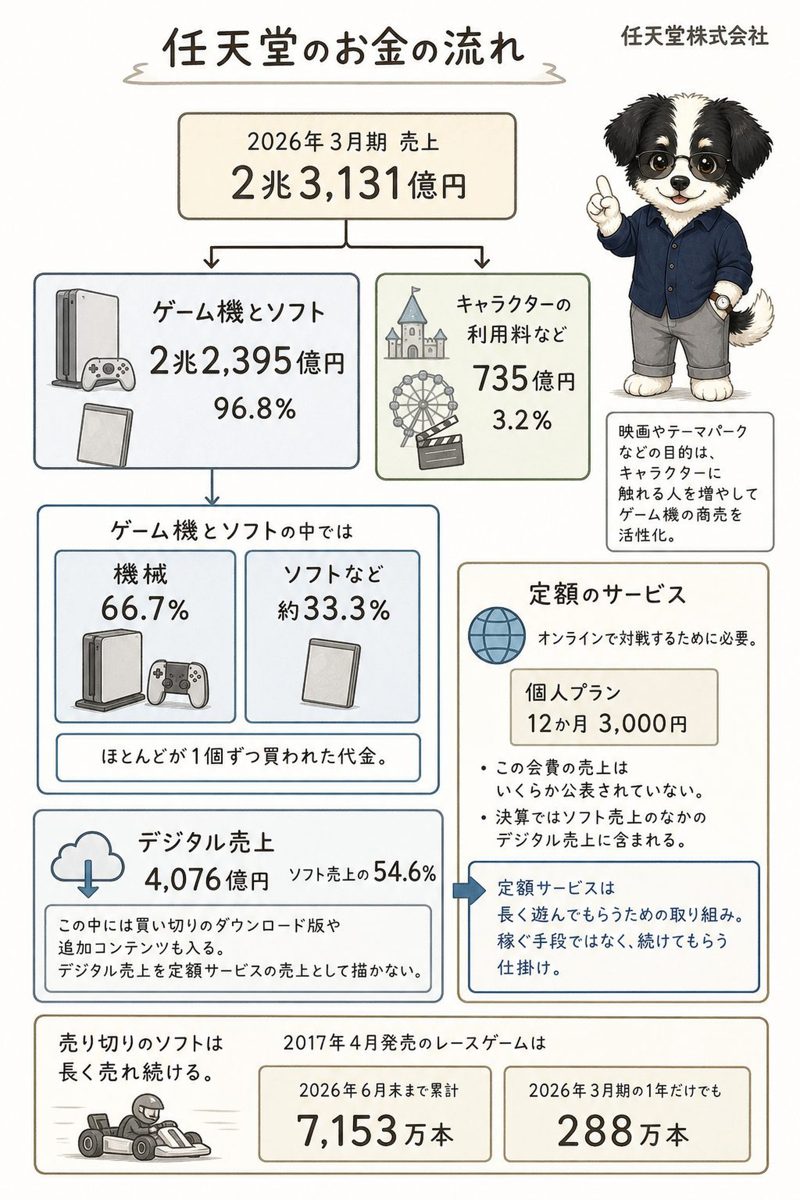
Sales of the dedicated video game platform business were ¥2.2395 trillion in the year ended March 2026, and IP-related income and others, which includes films and merchandise, came to ¥73.5 billion. The company explains the purpose of its films, theme parks, own stores, and merchandise as expanding the number of people who come into contact with Nintendo IP.
Mario Kart 8 Deluxe, released in 2017, had sold 71.53 million units by the end of June 2026. After the film released in 2023, it sold 8.18 million units in the year ended March 2024.
The move that changed Nintendo
It decided to make visual works by putting up its own money rather than by lending out the rights.
The Super Mario Bros. Movie, released in 2023, took $1.36125 billion at the worldwide box office and drew 169.84 million admissions, on Universal Pictures estimates carried in the company's materials. In the following year, the year ended March 2024, Mario Kart 8 Deluxe, released in 2017, sold 8.18 million copies, and the company says the film had a favourable effect on sales of Mario titles. Rather than leave visual works to the granting of rights alone, the company added Nintendo Pictures to the group in 2022 and Nintendo Stars in 2025.
Coverage in the book
- Nintendo Earns 96.8% of Its Sales from Dedicated Game Hardware and Software
- Annual Software Units Peaked at 235.07 Million in the Year Ended March 2022
- Nine Years After Release, Mario Kart 8 Deluxe Has Sold 71.53 Million Copies
- Digital Sales Reached 54.6% of Software Sales
- R&D Expenses Went from ¥59.2 Billion to ¥177.9 Billion over Ten Fiscal Years
Vol.4, Chapter 7 (as of 2026-08-22)
A company that earns by selling outright, in the age of subscriptions.
“Kaisha no Shikumi: Subscriptions”, Chapter 7: Nintendo: Earning from One-Time Purchases in the Age of Subscriptions
Book’s reference date 2026-08-22 / data last checked 2026-10-20
Key points in this volumeA subscription business's profits cannot be judged by member count alone.
About 96.8% of Nintendo's sales sits in a segment called dedicated video game platforms. Sales of the subscription service alone are contained within that segment.
For the other 7 companies covered in the book, recurring payments were either the pillar of sales or the entrance to it. This company alone puts buying at the centre.
The move that changed Nintendo
It explained the release of a film as a way to widen the number of people who come into contact with Nintendo IP and to enliven the dedicated video game platform business.
In 2023 Nintendo released The Super Mario Bros. Movie. Mobile and IP-related income and the like in the following year, the year ended March 2024, was ¥92.7 billion ($579 million), a rise of 81.6% from the year before. The company explained that most of the rise was a one-off tied to the theatrical release. IP-related income and the like in the year ended March 2026 was ¥73.5 billion, down 9.7% from the year before. The company describes the aim of this work as widening the number of people who come into contact with Nintendo IP and enlivening the dedicated video game platform business. Net sales in the year ended March 2026 were ¥2.3131 trillion, the highest the company has recorded, but that was the year Switch 2 went on sale. How much the IP work contributed is not published.
Coverage in the book
- A Game in Its Ninth Year on Sale, and 2.88 Million Copies in One Year
- The Sales of the Flat-Rate Service Sit Inside a Line
- Sales and the Dividend Swing With the Hardware Generation
- Membership Numbers Are Published Only at Milestones
- Nintendo's Ten Fiscal Years, and 40% of Operating Profit
Related books, articles and videos
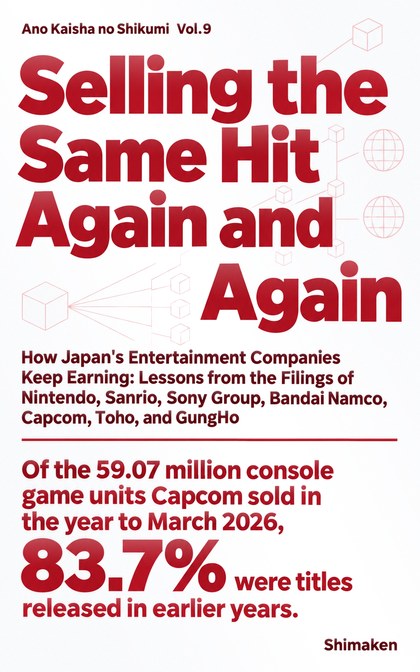 “Kaisha no Shikumi: Selling the Same Hit Again and Again”
Chapter 1: Nintendo
“Nintendo and Sanrio: One Sells the Finished Product Itself, the Other Has Others Make It and Collects a Fee”
“Ano Kaisha no Shikumi” series, Vol.9 — Kindle and paperback
Find it on Amazon →
 “Kaisha no Shikumi: Subscriptions”
Chapter 7: Nintendo
“Nintendo: Earning from One-Time Purchases in the Age of Subscriptions”
“Ano Kaisha no Shikumi” series, Vol.4 — Kindle and paperback
Find it on Amazon →
 note任天堂の売上の96.8%は「ゲーム専用機」 9年前のソフトが、いまも年288万本売れている (Japanese)
2026-09-22
 note任天堂の売上の96.8%は専用ゲーム機のハードとソフト マリオカート8 デラックスは9年で7,153万本 (Japanese)
2026-09-20
 Video会員3,400万アカウント超。ただし全部が払っているわけではない 任天堂の決算で学ぶ「会員数の中身」の読み方 (Japanese)
2026-09-15
 Video任天堂の売上の96.8%は専用ゲーム機のハードとソフト マリオカート8 デラックスは9年で7,153万本 (Japanese)
2026-09-14
Company profile
Tables scroll sideways
Disclosed data
Business activities and revenue composition
Revenue and profit by business segment
Disclosed segments (business divisions used in reporting): one
Revenue and profit
Nintendo
Period Apr 2025 to Mar 2026Source Annual securities reports
Amounts by account
| Group | Account | Amount | Consolidated / Non-consolidated |
|---|---|---|---|
| Selling, general and administrative expenses | Research and development expenses | ¥177.9 billion | Consolidated |
| Advertising expenses | ¥144.7 billion | Consolidated | |
| Salaries, allowances and bonuses | ¥57.8 billion | Consolidated | |
| Retirement benefit expenses | ¥11.5 billion | Consolidated | |
| Depreciation | ¥4.3 billion | Consolidated | |
| Provision for bonuses | ¥1.3 billion | Consolidated | |
| Provision of allowance for doubtful accounts | ¥28.00 million | Consolidated | |
| Profit by stage | Gross profit (loss) | ¥909.0 billion | Consolidated |
| Ordinary income | ¥542.2 billion | Consolidated | |
| Net income | ¥424.1 billion | Consolidated | |
| Operating income | ¥360.1 billion | Consolidated |
Nintendo
Selling, general and administrative expenses
Period Apr 2025 to Mar 2026Source Annual securities reports
- Research and development expenses ¥177.9 billion
- Advertising expenses ¥144.7 billion
- Salaries, allowances and bonuses ¥57.8 billion
- Retirement benefit expenses ¥11.5 billion
- Depreciation ¥4.3 billion
- Provision for bonuses ¥1.3 billion
- Other (not itemized) ¥151.4 billion
Performance, financial position and capital allocation
Long-term changes in performance
Nintendo
Long-term revenue, profit and asset trends
Period 2013 to 2026Source Annual securities reportsDisclosed
Nintendo
Recent performance trends
Source Annual securities reports
Year-on-year comparison
| Item | 2022 | 2023 | 2024 | 2025 | 2026 |
|---|---|---|---|---|---|
| Net sales | ¥1,695.3B | ¥1,601.7B | ¥1,671.9B | ¥1,164.9B | ¥2,313.1B |
| Year on year (%) | -3.6% | -5.5% | +4.4% | -30.3%◆ | +98.6%◆ |
| Ordinary income (loss) | ¥670.8B | ¥601.1B | ¥680.5B | ¥372.3B | ¥542.2B |
| Change from prior year | -1.2% | -10.4% | +13.2% | -45.3% | +45.6% |
| Ordinary income (loss) as a share of Net sales | 39.6% | 37.5% | 40.7% | 32.0% | 23.4% |
| Change (percentage points) | +1.0 points | -2.0 points◆ | +3.2 points◆ | -8.7 points◆ | -8.5 points◆ |
Fiscal periods marked for changes
Earlier fiscal periods (8)
- 2015Ordinary income (loss) as a share of revenue +11.8 points
- 2016Ordinary income (loss) as a share of revenue -7.1 points
- 2017Ordinary income (loss) as a share of revenue +4.6 points
- 2018Net sales year on year +115.8%, Ordinary income (loss) as a share of revenue +8.6 points
- 2019Ordinary income (loss) as a share of revenue +4.2 points
- 2020Ordinary income (loss) as a share of revenue +4.4 points
- 2021Net sales year on year +34.4%, Ordinary income (loss) as a share of revenue +11.1 points
- 2023Ordinary income (loss) as a share of revenue -2.0 points
- 2024Ordinary income (loss) as a share of revenue +3.2 points
- 2025Net sales year on year -30.3%, Ordinary income (loss) as a share of revenue -8.7 points
- 2026Net sales year on year +98.6%, Ordinary income (loss) as a share of revenue -8.5 points
Nintendo
Earnings and net assets per share over time
Unit yenSource Annual securities reports
Nintendo
Return on equity over time
Unit %Source Annual securities reports
Consolidated indicators (14 items)
| Item | 4 years ago | 3 years ago | 2 years ago | Last year | This year |
|---|---|---|---|---|---|
| Net sales | ¥1,695.3 billion | ¥1,601.7 billion | ¥1,671.9 billion | ¥1,164.9 billion | ¥2,313.1 billion |
| Ordinary income (loss) | ¥670.8 billion | ¥601.1 billion | ¥680.5 billion | ¥372.3 billion | ¥542.2 billion |
| Net income (loss) attributable to owners of parent | ¥477.7 billion | ¥432.8 billion | ¥490.6 billion | ¥278.8 billion | ¥424.1 billion |
| Comprehensive income | ¥530.5 billion | ¥486.7 billion | ¥573.8 billion | ¥313.8 billion | ¥477.4 billion |
| Net assets | ¥2,069.3 billion | ¥2,266.5 billion | ¥2,605.0 billion | ¥2,725.4 billion | ¥2,955.2 billion |
| Total assets | ¥2,662.4 billion | ¥2,854.3 billion | ¥3,151.4 billion | ¥3,398.5 billion | ¥3,805.3 billion |
| Net assets per share | 1,763.56 yen | 1,946.55 yen | 2,236.45 yen | 2,339.99 yen | 2,562.41 yen |
| Basic earnings (loss) per share | 404.67 yen | 371.41 yen | 421.39 yen | 239.47 yen | 364.51 yen |
| Equity-to-asset ratio | 77.7% | 79.4% | 82.6% | 80.2% | 77.6% |
| Return on equity | 24.2% | 20.0% | 20.2% | 10.5% | 14.9% |
| Net cash provided by (used in) operating activities | ¥289.7 billion | ¥322.8 billion | ¥462.1 billion | ¥12.1 billion | ¥289.8 billion |
| Net cash provided by (used in) investing activities | ¥93.7 billion | ¥111.5 billion | ¥-630.6 billion | ¥753.1 billion | ¥-210.1 billion |
| Net cash provided by (used in) financing activities | ¥-337.0 billion | ¥-291.0 billion | ¥-237.0 billion | ¥-195.1 billion | ¥-249.7 billion |
| Cash and cash equivalents | ¥1,022.7 billion | ¥1,194.6 billion | ¥853.4 billion | ¥1,414.1 billion | ¥1,316.7 billion |
Parent only indicators (14 items)
| Item | 4 years ago | 3 years ago | 2 years ago | Last year | This year |
|---|---|---|---|---|---|
| Net sales | ¥1,437.8 billion | ¥1,409.5 billion | ¥1,184.0 billion | ¥999.0 billion | ¥1,885.4 billion |
| Ordinary income (loss) | ¥630.0 billion | ¥630.2 billion | ¥497.3 billion | ¥263.8 billion | ¥338.8 billion |
| Net income (loss) | ¥462.5 billion | ¥484.6 billion | ¥352.0 billion | ¥225.8 billion | ¥271.7 billion |
| Capital stock | ¥10.1 billion | ¥10.1 billion | ¥10.1 billion | ¥10.1 billion | ¥10.1 billion |
| Total number of issued shares (common stock) | 129,869,000 shares | 1,298,690,000 shares | 1,298,690,000 shares | 1,298,690,000 shares | 1,287,260,000 shares |
| Net assets | ¥1,410.4 billion | ¥1,603.8 billion | ¥1,721.2 billion | ¥1,789.1 billion | ¥1,798.0 billion |
| Total assets | ¥1,857.6 billion | ¥2,001.0 billion | ¥2,071.1 billion | ¥2,186.5 billion | ¥2,362.7 billion |
| Net assets per share | 1,202.2 yen | 1,377.58 yen | 1,478.35 yen | 1,536.72 yen | 1,559.66 yen |
| Dividend per share | 2,030 yen | 753 yen | 211 yen | 120 yen | 219 yen |
| Interim dividend per share | 620 yen | 630 yen | 80 yen | 35 yen | 42 yen |
| Basic earnings (loss) per share | 391.81 yen | 415.92 yen | 302.37 yen | 193.96 yen | 233.52 yen |
| Equity-to-asset ratio | 75.9% | 80.2% | 83.1% | 81.8% | 76.1% |
| Return on equity | 34.4% | 32.2% | 21.2% | 12.9% | 15.2% |
| Payout ratio | 51.8% | 44.7% | 69.8% | 61.9% | 93.8% |
Dividend history
| Fiscal year | Annual dividend per share | Of which interim | Payout ratio (as reported, parent only) | Flag |
|---|---|---|---|---|
| FY ending 3/2026 | ¥219 | ¥42 | 93.8% | |
| FY ending 3/2025 | ¥120 | ¥35 | 61.9% | |
| FY ending 3/2024 | ¥211 | ¥80 | 69.8% | |
| FY ending 3/2023 | ¥753 | ¥630 | 44.7% | Stock split or share consolidation noted |
| FY ending 3/2022 | ¥2,030 | ¥620 | 51.8% | |
| FY ending 3/2021 | ¥2,220 | ¥810 | 65.6% | |
| FY ending 3/2020 | ¥1,090 | ¥270 | 61.6% | |
| FY ending 3/2019 | ¥810 | ¥170 | 59.5% | |
| FY ending 3/2018 | ¥590 | ¥110 | 74.6% | |
| FY ending 3/2017 | ¥430 | ¥0 | Could not be retrieved | |
| FY ending 3/2016 | ¥150 | ¥30 | 398.9% | |
| FY ending 3/2015 | ¥180 | ¥0 | 51.4% | |
| FY ending 3/2014 | ¥100 | ¥0 | 54.2% | |
| FY ending 3/2013 | ¥100 | ¥0 | 91.1% |
Nintendo
Dividends per share over time
Unit yenSource Annual securities reports
Shareholder composition
Share ownership by holder category
Nintendo
Unit %Source Annual securities reports
- Financial institutions25.28%
- Securities firms3.00%
- Other corporations2.30%
- Foreign holders (institutions)51.35%
- Foreign holders (individuals)0.06%
- Individuals and others18.01%
Research and development expenses and capital expenditure
| Fiscal year | Research and development | Capital expenditure |
|---|---|---|
| FY ending 3/2026 | ¥177.9 billion | ¥49.3 billion |
| FY ending 3/2025 | ¥143.8 billion | Could not be retrieved |
| FY ending 3/2021 | ¥93.2 billion | ¥17.9 billion |
| FY ending 3/2020 | ¥84.2 billion | Could not be retrieved |
| FY ending 3/2017 | ¥59.2 billion | Could not be retrieved |
| FY ending 3/2016 | ¥69.1 billion | Could not be retrieved |
Revenue scale in the same industry
Nintendo
Source Annual securities reports of each company
Other Products: 120 companies · revenue · largest first・FY Mar 2026・Consolidated・Disclosed
- 1 NintendoThis company ¥2.3T
- 2 TOPPAN ¥1.8T
- 3 Dai Nippon Printing ¥1.5T
- … 117 companies
Workforce information
Women 12.3 yrs Average length of service by gender
Women 692 Employees by gender
Administrative filings and published information
Workplace information filings
| Item | Value |
|---|---|
| Employees | 2,962 |
| Annual paid leave taken |
85.8% |
| Childcare leave taken, men |
82% |
| Childcare leave taken, women |
100% |
| Share of managers who are women | 5.8% |
| Share of board members who are women | 28.6% |
Greenhouse gas emissions
| Category | Emissions |
|---|---|
| 特定事業所排出者 | 6,565 t-CO2 |
| Sites covered by the report | 1 |
Audit and disclosure information
| Item | Value |
|---|---|
| Audit firm | PwCJapan有限責任監査法人 |
| Audit fees (this year, total) | ¥0.1 billion |
| Non-audit fees (this year, total) | ¥2.00 million |
| Audit fees (this year, network firms) | ¥0.4 billion |
| Non-audit fees (this year, network firms) | ¥99.00 million |
| Going concern note | Cannot be determined |
| Accounting standard | Japanese GAAP |
Sources and methodology
Retrieved disclosed figures
Major management indicators (5 years) (28 items)
| Item | Value | Consolidated / Non-consolidated |
|---|---|---|
| Comprehensive income | ¥477.4 billion | Consolidated |
| Net cash provided by (used in) operating activities | ¥289.8 billion | Consolidated |
| Net sales | ¥2,313.1 billion | Consolidated |
| Net cash provided by (used in) investing activities | ¥-210.1 billion | Consolidated |
| Cash and cash equivalents | ¥1,316.7 billion | Consolidated |
| Net assets | ¥2,955.2 billion | Consolidated |
| Ordinary income (loss) | ¥542.2 billion | Consolidated |
| Total assets | ¥3,805.3 billion | Consolidated |
| Return on equity | 14.9% | Consolidated |
| Equity-to-asset ratio | 77.6% | Consolidated |
| Net income (loss) attributable to owners of parent | ¥424.1 billion | Consolidated |
| Net cash provided by (used in) financing activities | ¥-249.7 billion | Consolidated |
| Basic earnings (loss) per share | 364.51 yen | Consolidated |
| Net assets per share | 2,562.41 yen | Consolidated |
| Dividend per share | 219 yen | Parent only |
| Net sales | ¥1,885.4 billion | Parent only |
| Net income (loss) | ¥271.7 billion | Parent only |
| Total number of issued shares (common stock) | 1,287,260,000 shares | Parent only |
| Net assets | ¥1,798.0 billion | Parent only |
| Ordinary income (loss) | ¥338.8 billion | Parent only |
| Total assets | ¥2,362.7 billion | Parent only |
| Return on equity | 15.2% | Parent only |
| Equity-to-asset ratio | 76.1% | Parent only |
| Capital stock | ¥10.1 billion | Parent only |
| Payout ratio | 93.8% | Parent only |
| Interim dividend per share | 42 yen | Parent only |
| Basic earnings (loss) per share | 233.52 yen | Parent only |
| Net assets per share | 1,559.66 yen | Parent only |
Employees (10 items)
| Item | Value | Consolidated / Non-consolidated |
|---|---|---|
| Number of employees | 8,666 people | Consolidated |
| Number of employees | 8,666 people | Consolidated |
| Wage gap between men and women (all employees) | 72.7% | Parent only |
| Average length of service (years) | 14.6 years | Parent only |
| Average annual salary | ¥9.82 million | Parent only |
| Average age (years) | 40.5 years old | Parent only |
| Number of employees | 3,084 people | Parent only |
| Number of employees | 3,084 people | Parent only |
| Wage gap between men and women (regular employees) | 73.6% | Parent only |
| Wage gap between men and women (non-regular employees) | 84.2% | Parent only |
Shares (14 items)
| Item | Value | Consolidated / Non-consolidated |
|---|---|---|
| Number of shares held | 470,712,900 shares | Consolidated |
| Total number of shares held treasury shares etc | 134,431,200 shares | Consolidated |
| Number of issues whose number of shares decreased shares not listed investment shares held for purposes other than pure investment reporting company | 1 issues | Consolidated |
| Total sale amount for decreased shares shares not listed investment shares held for purposes other than pure investment reporting company | ¥33.8 billion | Consolidated |
| Number of shares | 1,287,260,000 shares | Consolidated |
| Shareholding ratio treasury shares etc | 10.4% | Consolidated |
| Shareholding ratio | 40.8% | Consolidated |
| Number of shares held in own name treasury shares etc | 134,431,200 shares | Consolidated |
| Number of voting rights | 11,498,912 units | Consolidated |
| Carrying amount on the balance sheet | ¥6.0 billion | Consolidated |
| Carrying amount on the balance sheet | ¥105.8 billion | Consolidated |
| Number of issues | 16 issues | Consolidated |
| Number of issues | 11 issues | Consolidated |
| Total shareholder return | 157.2% | Parent only |
Other disclosed items (6 items)
| Item | Value | Consolidated / Non-consolidated |
|---|---|---|
| Number of associates accounted for using equity method | 3 companies | Consolidated |
| Write-downs of inventories | ¥14.1 billion | Consolidated |
| Number of consolidated subsidiaries | 30 companies | Consolidated |
| Rate of male employees taking childcare leave (all employees) | 82.0% | Parent only |
| Total return on the share price index | 202.2% | Parent only |
| Ratio of female employees in managerial positions | 5.8% | Parent only |
Property and facilities (1 items)
| Item | Value | Consolidated / Non-consolidated |
|---|---|---|
| Capital expenditures | ¥49.3 billion | Consolidated |
Audit (10 items)
| Item | Value | Consolidated / Non-consolidated |
|---|---|---|
| Fees for audit and attestation services - reporting company | ¥0.1 billion | Consolidated |
| Fees for audit and attestation services - total | ¥0.4 billion | Consolidated |
| Fees for audit and attestation services - total | ¥0.1 billion | Consolidated |
| Fees for audit and attestation services - consolidated subsidiaries | ¥0.4 billion | Consolidated |
| Fees for audit and attestation services - consolidated subsidiaries | ¥19.00 million | Consolidated |
| Fees for non-audit services - reporting company | ¥16.00 million | Consolidated |
| Fees for non-audit services - reporting company | ¥2.00 million | Consolidated |
| Fees for non-audit services - total | ¥99.00 million | Consolidated |
| Fees for non-audit services - total | ¥2.00 million | Consolidated |
| Non audit fees consolidated subsidiaries network firms | ¥83.00 million | Consolidated |
Accounts unique to this company (1 items)
| Item | Value | Consolidated / Non-consolidated |
|---|---|---|
| Change in average annual salary from the previous year | 1.6% | Parent only |
Balance sheet (104 items)
| Item | Value | Consolidated / Non-consolidated |
|---|---|---|
| Other | ¥65.3 billion | Consolidated |
| Other | ¥61.9 billion | Consolidated |
| Other | ¥407.8 billion | Consolidated |
| Other | ¥105.7 billion | Consolidated |
| Other | ¥33.5 billion | Consolidated |
| Valuation difference on available-for-sale securities | ¥53.4 billion | Consolidated |
| Software | ¥11.1 billion | Consolidated |
| Work in process | ¥30.00 million | Consolidated |
| Retained earnings | ¥2,979.9 billion | Consolidated |
| Raw materials and supplies | ¥220.9 billion | Consolidated |
| Notes receivable - trade | ¥0.5 billion | Consolidated |
| Notes and accounts receivable trade | ¥147.5 billion | Consolidated |
| Non-current liabilities | ¥90.0 billion | Consolidated |
| Non-current assets | ¥795.5 billion | Consolidated |
| Land | ¥46.2 billion | Consolidated |
| Accounts receivable - trade | ¥147.0 billion | Consolidated |
| Contract liabilities | ¥174.9 billion | Consolidated |
| Tools, furniture and fixtures | ¥9.9 billion | Consolidated |
| Buildings and structures, net | ¥54.8 billion | Consolidated |
| Construction in progress | ¥14.5 billion | Consolidated |
| Investments and other assets | ¥623.4 billion | Consolidated |
| Investment securities | ¥420.9 billion | Consolidated |
| Notes and accounts payable - trade | ¥236.1 billion | Consolidated |
| Securities | ¥425.1 billion | Consolidated |
| Property, plant and equipment | ¥127.5 billion | Consolidated |
| Income taxes payable | ¥111.2 billion | Consolidated |
| Shareholders' equity | ¥2,663.2 billion | Consolidated |
| Inventories | ¥539.8 billion | Consolidated |
| Machinery, equipment and vehicles, net | ¥2.1 billion | Consolidated |
| Current liabilities | ¥760.1 billion | Consolidated |
| Current assets | ¥3,009.8 billion | Consolidated |
| Accumulated depreciation | ¥-108.4 billion | Consolidated |
| Foreign currency translation adjustment | ¥237.4 billion | Consolidated |
| Intangible assets | ¥44.6 billion | Consolidated |
| Cash and cash equivalents | ¥1,316.7 billion | Consolidated |
| Cash and deposits | ¥1,791.8 billion | Consolidated |
| Net assets | ¥2,955.2 billion | Consolidated |
| Net assets | ¥2,955.2 billion | Consolidated |
| Total assets | ¥3,805.3 billion | Consolidated |
| Deferred tax assets | ¥121.9 billion | Consolidated |
| Treasury stock | ¥-341.9 billion | Consolidated |
| Finished goods | ¥318.8 billion | Consolidated |
| Valuation and translation adjustments | ¥290.9 billion | Consolidated |
| Liabilities | ¥850.1 billion | Consolidated |
| Liabilities and net assets | ¥3,805.3 billion | Consolidated |
| Allowance for doubtful accounts | ¥-52.00 million | Consolidated |
| Capital surplus | ¥15.0 billion | Consolidated |
| Capital stock | ¥10.1 billion | Consolidated |
| Provision for bonuses | ¥5.1 billion | Consolidated |
| Net defined benefit liability | ¥24.7 billion | Consolidated |
| Net defined benefit asset | ¥18.8 billion | Consolidated |
| Non-controlling interests | ¥1.2 billion | Consolidated |
| Other | ¥1.8 billion | Parent only |
| Other | ¥20.2 billion | Parent only |
| Other | ¥70.5 billion | Parent only |
| Other | ¥107.2 billion | Parent only |
| Other | ¥1.2 billion | Parent only |
| Valuation difference on available-for-sale securities | ¥54.2 billion | Parent only |
| Other, net | ¥1.7 billion | Parent only |
| Software | ¥8.8 billion | Parent only |
| Work in process | ¥30.00 million | Parent only |
| General reserve | ¥860.0 billion | Parent only |
| Retained earnings | ¥2,064.1 billion | Parent only |
| Legal retained earnings | ¥2.5 billion | Parent only |
| Advances received | ¥108.2 billion | Parent only |
| Raw materials and supplies | ¥168.2 billion | Parent only |
| Notes and accounts receivable trade | ¥246.3 billion | Parent only |
| Non-current liabilities | ¥6.5 billion | Parent only |
| Non-current assets | ¥429.6 billion | Parent only |
| Reserve for advanced depreciation of noncurrent assets | ¥18.00 million | Parent only |
| Land | ¥38.1 billion | Parent only |
| Tools, furniture and fixtures | ¥4.4 billion | Parent only |
| Buildings, net | ¥29.3 billion | Parent only |
| Construction in progress | ¥14.0 billion | Parent only |
| Investments and other assets | ¥332.1 billion | Parent only |
| Investment securities | ¥112.8 billion | Parent only |
| Notes and accounts payable - trade | ¥220.0 billion | Parent only |
| Securities | ¥109.0 billion | Parent only |
| Property, plant and equipment | ¥87.6 billion | Parent only |
| Income taxes payable | ¥98.4 billion | Parent only |
| Accounts payable - other | ¥56.9 billion | Parent only |
| Shareholders' equity | ¥1,743.9 billion | Parent only |
| Inventories | ¥196.2 billion | Parent only |
| Current liabilities | ¥558.2 billion | Parent only |
| Current assets | ¥1,933.1 billion | Parent only |
| Intangible assets | ¥9.9 billion | Parent only |
| Cash and deposits | ¥1,274.3 billion | Parent only |
| Net assets | ¥1,798.0 billion | Parent only |
| Net assets | ¥1,798.0 billion | Parent only |
| Total assets | ¥2,362.7 billion | Parent only |
| Deferred tax assets | ¥135.1 billion | Parent only |
| Retained earnings brought forward | ¥1,201.5 billion | Parent only |
| Treasury stock | ¥-341.9 billion | Parent only |
| Finished goods | ¥28.0 billion | Parent only |
| Valuation and translation adjustments | ¥54.2 billion | Parent only |
| Liabilities | ¥564.7 billion | Parent only |
| Liabilities and net assets | ¥2,362.7 billion | Parent only |
| Allowance for doubtful accounts | ¥-0 | Parent only |
| Capital surplus | ¥11.6 billion | Parent only |
| Legal capital surplus | ¥11.6 billion | Parent only |
| Capital stock | ¥10.1 billion | Parent only |
| Provision for bonuses | ¥4.2 billion | Parent only |
| Provision for retirement benefits | ¥4.7 billion | Parent only |
| Shares of subsidiaries and associates | ¥64.1 billion | Parent only |
Statement of income (88 items)
| Item | Value | Consolidated / Non-consolidated |
|---|---|---|
| Other | ¥9.7 billion | Consolidated |
| Other | ¥0.2 billion | Consolidated |
| Other comprehensive income | ¥53.3 billion | Consolidated |
| Valuation difference on available for sale securities net of tax | ¥-14.7 billion | Consolidated |
| Dividends from surplus | ¥-147.9 billion | Consolidated |
| Comprehensive income | ¥477.4 billion | Consolidated |
| Interest income | ¥46.1 billion | Consolidated |
| Operating income | ¥360.1 billion | Consolidated |
| Non-operating income | ¥182.9 billion | Consolidated |
| Non-operating expenses | ¥0.8 billion | Consolidated |
| Net cash provided by (used in) operating activities | ¥289.8 billion | Consolidated |
| Loss on disposal of noncurrent assets | ¥0.3 billion | Consolidated |
| Gain on sales of non-current assets | ¥16.00 million | Consolidated |
| Cost of sales | ¥1,404.1 billion | Consolidated |
| Gross profit (loss) | ¥909.0 billion | Consolidated |
| Net sales | ¥2,313.1 billion | Consolidated |
| Advertising expenses | ¥144.7 billion | Consolidated |
| Net income | ¥424.1 billion | Consolidated |
| Net income | ¥424.1 billion | Consolidated |
| Net income (loss) | ¥424.1 billion | Consolidated |
| Net income (loss) | ¥424.1 billion | Consolidated |
| Gain on sales of investment securities | ¥32.7 billion | Consolidated |
| Net cash provided by (used in) investing activities | ¥-210.1 billion | Consolidated |
| Share of profit of investments accounted for using equity method | ¥82.8 billion | Consolidated |
| Share of other comprehensive income of investments accounted for using equity method | ¥2.6 billion | Consolidated |
| Interest expenses | ¥0.2 billion | Consolidated |
| Loss on redemption of seciritues | ¥0.4 billion | Consolidated |
| Income taxes - current | ¥176.3 billion | Consolidated |
| Income taxes | ¥144.1 billion | Consolidated |
| Income taxes - deferred | ¥-32.2 billion | Consolidated |
| Depreciation | ¥4.3 billion | Consolidated |
| Foreign exchange gains | ¥44.3 billion | Consolidated |
| Foreign currency translation adjustment net of tax | ¥65.4 billion | Consolidated |
| Extraordinary income | ¥32.7 billion | Consolidated |
| Extraordinary loss | ¥6.7 billion | Consolidated |
| Effect of exchange rate change on cash and cash equivalents | ¥72.5 billion | Consolidated |
| Net increase (decrease) in cash and cash equivalents | ¥-97.4 billion | Consolidated |
| Research and development expenses | ¥177.9 billion | Consolidated |
| Income (loss) before income taxes | ¥568.2 billion | Consolidated |
| Income (loss) before income taxes | ¥568.2 billion | Consolidated |
| Ordinary income | ¥542.2 billion | Consolidated |
| Salaries, allowances and bonuses | ¥57.8 billion | Consolidated |
| Disposal of treasury stock | ¥0.1 billion | Consolidated |
| Purchase of treasury stock | ¥-99.9 billion | Consolidated |
| Comprehensive income attributable to owners of parent | ¥477.3 billion | Consolidated |
| LossOnLitigationSGAIFRS | ¥6.4 billion | Consolidated |
| Net cash provided by (used in) financing activities | ¥-249.7 billion | Consolidated |
| Selling, general and administrative expenses | ¥548.8 billion | Consolidated |
| Provision of allowance for doubtful accounts | ¥28.00 million | Consolidated |
| Provision for bonuses | ¥1.3 billion | Consolidated |
| Retirement benefit expenses | ¥11.5 billion | Consolidated |
| Comprehensive income attributable to non-controlling interests | ¥36.00 million | Consolidated |
| Net income (loss) attributable to non-controlling interests | ¥36.00 million | Consolidated |
| Other | ¥5.6 billion | Parent only |
| Other | ¥37.00 million | Parent only |
| Dividends from surplus | ¥-147.9 billion | Parent only |
| Interest income | ¥18.2 billion | Parent only |
| Dividend income | ¥37.5 billion | Parent only |
| Operating income | ¥214.6 billion | Parent only |
| Non-operating income | ¥124.6 billion | Parent only |
| Non-operating expenses | ¥0.5 billion | Parent only |
| Loss on disposal of noncurrent assets | ¥0.2 billion | Parent only |
| Gain on sales of non-current assets | ¥0 | Parent only |
| Cost of sales | ¥1,371.7 billion | Parent only |
| Gross profit (loss) | ¥513.7 billion | Parent only |
| Net sales | ¥1,885.4 billion | Parent only |
| Advertising expenses | ¥31.1 billion | Parent only |
| Net income (loss) | ¥271.7 billion | Parent only |
| Net income (loss) | ¥271.7 billion | Parent only |
| Gain on sales of investment securities | ¥32.7 billion | Parent only |
| Interest expenses | ¥0 | Parent only |
| Loss on redemption of seciritues | ¥0.4 billion | Parent only |
| Income taxes - current | ¥130.4 billion | Parent only |
| Income taxes | ¥93.2 billion | Parent only |
| Income taxes - deferred | ¥-37.2 billion | Parent only |
| Depreciation | ¥4.6 billion | Parent only |
| Foreign exchange gains | ¥63.4 billion | Parent only |
| Extraordinary income | ¥32.7 billion | Parent only |
| Extraordinary loss | ¥6.6 billion | Parent only |
| Research and development expenses | ¥180.8 billion | Parent only |
| Income (loss) before income taxes | ¥364.9 billion | Parent only |
| Ordinary income | ¥338.8 billion | Parent only |
| Disposal of treasury stock | ¥0.1 billion | Parent only |
| Purchase of treasury stock | ¥-99.9 billion | Parent only |
| LossOnLitigationSGAIFRS | ¥6.4 billion | Parent only |
| Selling, general and administrative expenses | ¥299.1 billion | Parent only |
| Provision of allowance for doubtful accounts | ¥-0 | Parent only |
| Provision for bonuses | ¥1.1 billion | Parent only |
Statement of changes in equity (4 items)
| Item | Value | Consolidated / Non-consolidated |
|---|---|---|
| Total changes during the period | ¥229.7 billion | Consolidated |
| Net changes in items other than shareholders' equity | ¥53.3 billion | Consolidated |
| Total changes during the period | ¥8.9 billion | Parent only |
| Net changes in items other than shareholders' equity | ¥-15.1 billion | Parent only |
Statement of cash flows (25 items)
| Item | Value | Consolidated / Non-consolidated |
|---|---|---|
| Other | ¥-8.5 billion | Consolidated |
| Other | ¥2.0 billion | Consolidated |
| Other | ¥-1.9 billion | Consolidated |
| Increase decrease in notes and accounts payable trade | ¥79.7 billion | Consolidated |
| Interest expenses paid | ¥-0.2 billion | Consolidated |
| Interest and dividends income received | ¥52.5 billion | Consolidated |
| Interest and dividend income | ¥-53.1 billion | Consolidated |
| Decrease increase in notes and accounts receivable trade | ¥-74.8 billion | Consolidated |
| Proceeds from withdrawal of time deposits | ¥1,497.2 billion | Consolidated |
| Payments into time deposits | ¥-1,841.5 billion | Consolidated |
| Subtotal | ¥342.9 billion | Consolidated |
| Equity in earnings losses of affiliates | ¥-82.8 billion | Consolidated |
| Purchase of short term and long term investment securities | ¥-256.2 billion | Consolidated |
| Proceeds from sales and redemption of investment securities | ¥415.6 billion | Consolidated |
| Purchase of property plant and equipment and intangible assets | ¥-27.2 billion | Consolidated |
| Proceeds from sales of property plant and equipment and intangible assets | ¥67.00 million | Consolidated |
| Decrease in consumption taxes payable | ¥-6.7 billion | Consolidated |
| Decrease (increase) in inventories | ¥-27.6 billion | Consolidated |
| Income taxes paid | ¥-105.4 billion | Consolidated |
| Depreciation | ¥15.9 billion | Consolidated |
| Foreign exchange loss (gain) | ¥-61.9 billion | Consolidated |
| Regarding purchase of treasury stock | ¥-99.9 billion | Consolidated |
| Increase (decrease) in allowance for doubtful accounts | ¥-0.1 billion | Consolidated |
| Increase (decrease) in net defined benefit liability | ¥-5.3 billion | Consolidated |
| Dividends | ¥-147.9 billion | Consolidated |
Research and development (1 items)
| Item | Value | Consolidated / Non-consolidated |
|---|---|---|
| Research and development expenses included in general and administrative expenses and manufacturing cost for current period | ¥177.9 billion | Consolidated |
Basic indicators
| Item | Value | Consolidated / Non-consolidated | Source |
|---|---|---|---|
| Net cash provided by (used in) operating activities | ¥289.8 billion | Consolidated | Disclosed |
| Dividend per share | 219 | Parent only | Disclosed |
| Number of employees | 8,666 | Consolidated | Disclosed |
| Net assets | ¥2,955.2 billion | Consolidated | Disclosed |
| Net sales | ¥2,313.1 billion | Consolidated | Disclosed |
| Operating income | ¥360.1 billion | Consolidated | Disclosed |
| Ordinary income | ¥542.2 billion | Consolidated | Disclosed |
| Net income | ¥424.1 billion | Consolidated | Disclosed |
| Total assets | ¥3,805.3 billion | Consolidated | Disclosed |
| Operating margin | 15.6% | Consolidated | Calculated |
| Net margin | 18.3% | Consolidated | Calculated |
| Sales per employee | 266911032 yen | Consolidated | Calculated |
| Total asset turnover | 0.61 times | Consolidated | Calculated |
| Net assets to total assets | 77.7% | Consolidated | Calculated |