YKK
YKK Corporation
Company highlights
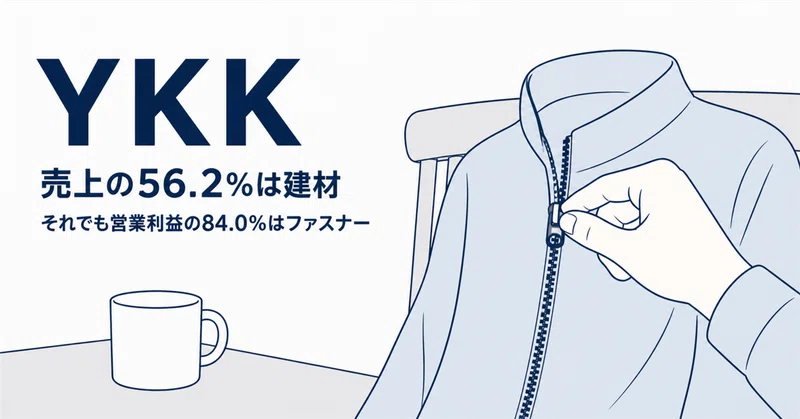
Sales come from building materials, profit from fasteners.
Vol.7, Chapter 1 (as of 2026-08-31)
Key figures
Period Apr 2025 to Mar 2026ConsolidatedJapanese GAAP
Business revenue model
Featured in
Vol.7, Chapter 1 (as of 2026-08-31)
“Kaisha no Shikumi: The Companies You Use Every Day”, Chapter 1: YKK and Shimano: One Makes Its Own Materials and Machines, the Other Designs Its Parts as a Single Series
Book’s reference date 2026-08-31 / data last checked 2026-10-20
Key points in this volumeA company's profits depend not just on how advanced its technology is, but on how hard it is for customers to switch suppliers.
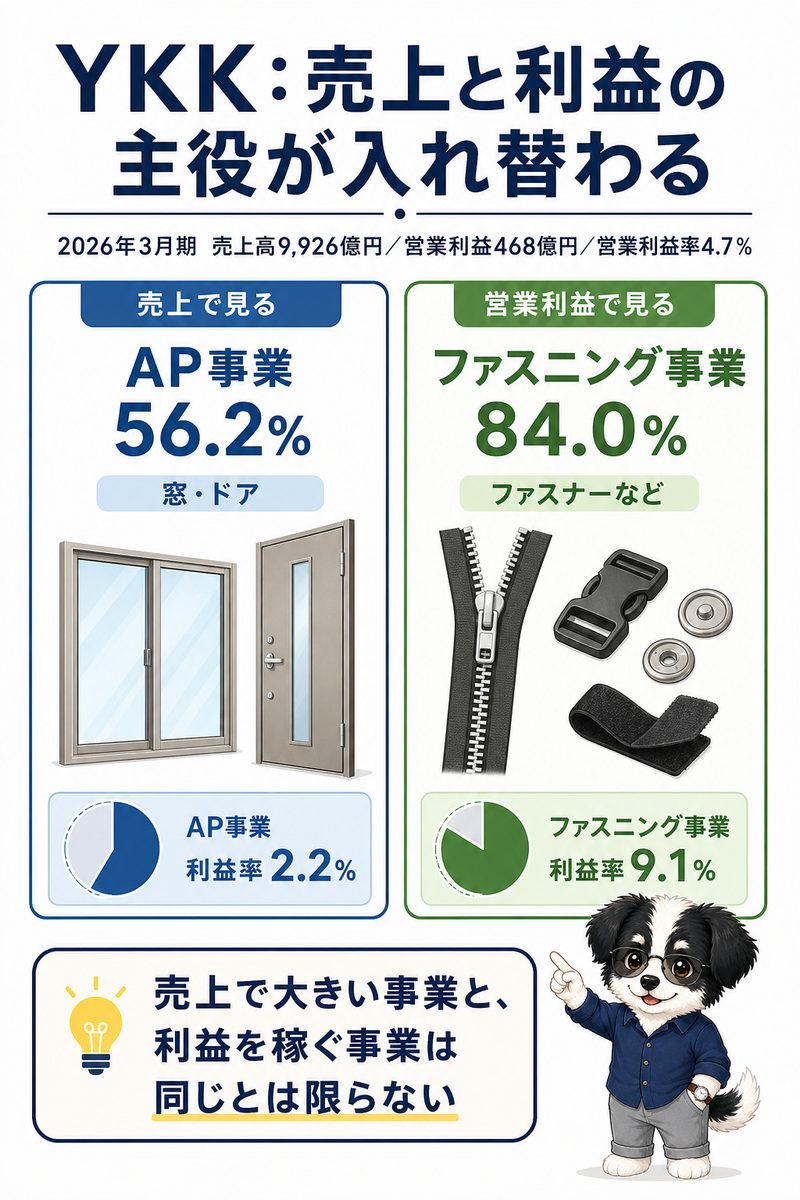
For the year ended March 2026, net sales were ¥992.6 billion and operating income ¥46.8 billion, a margin of 4.7%. The architectural products business, windows and doors, is 56.2% of sales, yet 84.0% of operating income is earned by the fastening business.
By segment margin, fastening is 9.1% against 2.2% for the AP architectural business (both calculated). In fiscal 2024 it sold more than 10 billion fasteners in a single year. No single customer accounts for more than a tenth of sales.
The move that changed YKK
YKK bought a housing equipment company for ¥147.0 billion ($919 million) as a third business alongside zippers and windows.
On March 31, 2026, through an investment subsidiary, YKK acquired 80% of the stock of Panasonic Housing Solutions from Panasonic Holdings. Panasonic keeps 20%. The purchase price was ¥147.006 billion ($919 million), the goodwill recorded was ¥72.825 billion, and the cash that went out on the acquisition was ¥133.212 billion. Because the acquisition date fell on the last day of the fiscal year, it had almost no effect on profit or loss for the year ended March 2026, and the balance sheet carries ¥291.515 billion of assets in a newly created HS business. In the first quarter of the year ending March 2027 the HS business recorded sales of ¥123.7 billion and segment profit of ¥700 million. Whether the goodwill can be recovered cannot be judged as of the date of this research.
Coverage in the book
- The Biggest Business by Sales Is Not the Biggest by Profit
- Where YKK's Money Comes From
- The Annual Unit Sales the Company Publishes
- Making Everything In-House, from the Materials to the Machines
- In the Year Ended March 2026, Profit Fell in Both Businesses Even After Price Increases
Related books, articles and videos
 “Kaisha no Shikumi: The Companies You Use Every Day”
Chapter 1: YKK
“YKK and Shimano: One Makes Its Own Materials and Machines, the Other Designs Its Parts as a Single Series”
“Ano Kaisha no Shikumi” series, Vol.7 — Kindle and paperback
Find it on Amazon →

Company profile
Tables scroll sideways
Disclosed data
Business activities and revenue composition
YKK
Revenue and profit by business segment
Period Apr 2025 to Mar 2026Source Annual securities reportsConsolidated・Disclosed
| Business | Net sales to external customers | Operating income | |||||
|---|---|---|---|---|---|---|---|
| This year | Share | Last year | This year | Share | Margin | Last year | |
| AP | ¥557.5 billion | 56.5% | ¥561.4 billion | ¥12.0 billion | 23.5% | 2.2% | ¥18.1 billion |
| ファスニング | ¥429.2 billion | 43.5% | ¥430.8 billion | ¥39.3 billion | 76.5% | 9.2% | ¥47.5 billion |
| Total of the businesses | ¥986.7 billion | 100.0% | ¥51.3 billion | 100.0% | |||
Revenue and profit
YKK
Period Apr 2025 to Mar 2026Source Annual securities reports
Amounts by account
| Group | Account | Amount | Consolidated / Non-consolidated |
|---|---|---|---|
| Selling, general and administrative expenses | Employees' salaries and allowances | ¥113.5 billion | Consolidated |
| Packing and transportation expenses | ¥31.8 billion | Consolidated | |
| Provision for bonuses | ¥14.2 billion | Consolidated | |
| Retirement benefit expenses | ¥9.4 billion | Consolidated | |
| Commission fees | ¥7.8 billion | Parent only | |
| Depreciation | ¥4.2 billion | Parent only | |
| Amortization of goodwill | ¥0.9 billion | Consolidated | |
| Provision of allowance for doubtful accounts | ¥-87.00 million | Consolidated | |
| Provision for directors' retirement benefits | ¥15.00 million | Consolidated | |
| Profit by stage | Gross profit (loss) | ¥345.3 billion | Consolidated |
| Ordinary income | ¥54.5 billion | Consolidated | |
| Operating income | ¥46.8 billion | Consolidated | |
| Net income | ¥31.7 billion | Consolidated |
YKK
Selling, general and administrative expenses
Period Apr 2025 to Mar 2026Source Annual securities reports
- Employees' salaries and allowances ¥113.5 billion
- Packing and transportation expenses ¥31.8 billion
- Provision for bonuses ¥14.2 billion
- Retirement benefit expenses ¥9.4 billion
- Commission fees ¥7.8 billion
- Depreciation ¥4.2 billion
- Other (not itemized) ¥117.6 billion
Performance, financial position and capital allocation
Long-term changes in performance
YKK
Long-term revenue, profit and asset trends
Period 2013 to 2026Source Annual securities reportsDisclosed
YKK
Recent performance trends
Source Annual securities reports
Year-on-year comparison
| Item | 2022 | 2023 | 2024 | 2025 | 2026 |
|---|---|---|---|---|---|
| Net sales | ¥797.0B | ¥893.2B | ¥920.2B | ¥998.3B | ¥992.6B |
| Year on year (%) | +21.9%◆ | +12.1% | +3.0% | +8.5% | -0.6% |
| Ordinary income (loss) | ¥64.0B | ¥60.7B | ¥60.8B | ¥70.3B | ¥54.5B |
| Change from prior year | +112.3% | -5.1% | +0.2% | +15.6% | -22.5% |
| Ordinary income (loss) as a share of Net sales | 8.0% | 6.8% | 6.6% | 7.0% | 5.5% |
| Change (percentage points) | +3.4 points◆ | -1.2 points | -0.2 points | +0.4 points | -1.6 points |
Fiscal periods marked for changes
- 2014Net sales year on year +20.8%, Ordinary income (loss) as a share of revenue +3.6 points
- 2020Ordinary income (loss) as a share of revenue -2.6 points
- 2022Net sales year on year +21.9%, Ordinary income (loss) as a share of revenue +3.4 points
YKK
Earnings and net assets per share over time
Unit yenSource Annual securities reports
YKK
Return on equity over time
Unit %Source Annual securities reports
Consolidated indicators (14 items)
| Item | 4 years ago | 3 years ago | 2 years ago | Last year | This year |
|---|---|---|---|---|---|
| Net sales | ¥797.0 billion | ¥893.2 billion | ¥920.2 billion | ¥998.3 billion | ¥992.6 billion |
| Ordinary income (loss) | ¥64.0 billion | ¥60.7 billion | ¥60.8 billion | ¥70.3 billion | ¥54.5 billion |
| Net income (loss) attributable to owners of parent | ¥44.1 billion | ¥37.9 billion | ¥42.4 billion | ¥53.0 billion | ¥31.7 billion |
| Comprehensive income | ¥105.1 billion | ¥72.9 billion | ¥152.0 billion | ¥56.5 billion | ¥131.5 billion |
| Net assets | ¥837.3 billion | ¥906.3 billion | ¥1,054.5 billion | ¥1,107.0 billion | ¥1,285.6 billion |
| Total assets | ¥1,156.9 billion | ¥1,221.6 billion | ¥1,355.3 billion | ¥1,402.3 billion | ¥1,845.1 billion |
| Net assets per share | 682,026 yen | 738,691 yen | 860,211 yen | 903,763 yen | 1,007,190 yen |
| Basic earnings (loss) per share | 36,782 yen | 31,638 yen | 35,339 yen | 44,173 yen | 26,416 yen |
| Equity-to-asset ratio | 70.7% | 72.5% | 76.1% | 77.3% | 65.4% |
| Return on equity | 5.7% | 4.5% | 4.4% | 5.0% | 2.8% |
| Net cash provided by (used in) operating activities | ¥81.1 billion | ¥81.7 billion | ¥105.7 billion | ¥118.7 billion | ¥95.0 billion |
| Net cash provided by (used in) investing activities | ¥-40.4 billion | ¥-55.9 billion | ¥-99.6 billion | ¥-75.2 billion | ¥-230.7 billion |
| Net cash provided by (used in) financing activities | ¥-5.8 billion | ¥-7.0 billion | ¥1.4 billion | ¥-8.5 billion | ¥141.7 billion |
| Cash and cash equivalents | ¥264.6 billion | ¥291.7 billion | ¥323.9 billion | ¥353.3 billion | ¥382.5 billion |
Parent only indicators (13 items)
| Item | 4 years ago | 3 years ago | 2 years ago | Last year | This year |
|---|---|---|---|---|---|
| Net sales | ¥91.0 billion | ¥97.5 billion | ¥97.1 billion | ¥108.8 billion | ¥112.8 billion |
| Ordinary income (loss) | ¥14.0 billion | ¥25.2 billion | ¥17.1 billion | ¥10.2 billion | ¥20.6 billion |
| Net income (loss) | ¥15.8 billion | ¥24.7 billion | ¥15.7 billion | ¥12.6 billion | ¥17.8 billion |
| Capital stock | ¥12.0 billion | ¥12.0 billion | ¥12.0 billion | ¥12.0 billion | ¥12.0 billion |
| Total number of issued shares (common stock) | 1,199,240.05 shares | 1,199,240.05 shares | 1,199,240.05 shares | 1,199,240.05 shares | 1,199,240.05 shares |
| Net assets | ¥378.9 billion | ¥401.5 billion | ¥418.6 billion | ¥431.6 billion | ¥451.9 billion |
| Total assets | ¥499.2 billion | ¥513.0 billion | ¥520.2 billion | ¥537.7 billion | ¥722.3 billion |
| Net assets per share | 316,058 yen | 334,877 yen | 349,156 yen | 360,053 yen | 376,957 yen |
| Dividend per share | 2,600 yen | 2,600 yen | 2,800 yen | 3,200 yen | 3,400 yen |
| Basic earnings (loss) per share | 13,153 yen | 20,585 yen | 13,070 yen | 10,533 yen | 14,807 yen |
| Equity-to-asset ratio | 75.9% | 78.3% | 80.5% | 80.3% | 62.6% |
| Return on equity | 4.2% | 6.3% | 3.8% | 3.0% | 4.0% |
| Payout ratio | 19.8% | 12.6% | 21.4% | 30.4% | 23.0% |
Dividend history
| Fiscal year | Annual dividend per share | Of which interim | Payout ratio (as reported, parent only) | Flag |
|---|---|---|---|---|
| FY ending 3/2026 | ¥3,400 | Could not be retrieved | 23.0% | |
| FY ending 3/2025 | ¥3,200 | Could not be retrieved | 30.4% | |
| FY ending 3/2024 | ¥2,800 | Could not be retrieved | 21.4% | |
| FY ending 3/2023 | ¥2,600 | Could not be retrieved | 12.6% | |
| FY ending 3/2022 | ¥2,600 | Could not be retrieved | 19.8% | |
| FY ending 3/2021 | ¥2,400 | Could not be retrieved | Could not be retrieved | |
| FY ending 3/2020 | ¥2,400 | Could not be retrieved | Could not be retrieved | |
| FY ending 3/2019 | ¥2,400 | Could not be retrieved | 29.1% | |
| FY ending 3/2018 | ¥2,400 | Could not be retrieved | 30.8% | |
| FY ending 3/2017 | ¥2,400 | Could not be retrieved | 16.4% | |
| FY ending 3/2016 | ¥2,400 | Could not be retrieved | 18.9% | |
| FY ending 3/2015 | ¥2,200 | Could not be retrieved | 22.4% | |
| FY ending 3/2014 | ¥2,200 | Could not be retrieved | 44.5% | |
| FY ending 3/2013 | ¥1,800 | Could not be retrieved | 35.6% |
YKK
Dividends per share over time
Unit yenSource Annual securities reports
Research and development expenses and capital expenditure
| Fiscal year | Research and development |
|---|---|
| FY ending 3/2026 | ¥30.2 billion |
| FY ending 3/2025 | ¥28.9 billion |
| FY ending 3/2021 | ¥19.7 billion |
| FY ending 3/2020 | ¥22.7 billion |
| FY ending 3/2017 | ¥21.9 billion |
| FY ending 3/2016 | ¥20.8 billion |
Revenue scale in the same industry
YKK
Source Annual securities reports of each company
Other Products: 120 companies · revenue · largest first・each company’s latest fiscal year・Consolidated・Disclosed
- 1 NintendoFY Mar 2026 ¥2.3T
- 2 TOPPANFY Mar 2026 ¥1.8T
- 3 Dai Nippon PrintingFY Mar 2026 ¥1.5T
- 4 Bandai NamcoFY Mar 2026 ¥1.3T
- 5 YKKThis companyFY Mar 2026 ¥992.6B
- 6 ASICSFY Dec 2025 ¥810.9B
- 7 YAMAHAFY Mar 2026 ¥465.3B
- … 113 companies
Workforce information
Administrative filings and published information
Workplace information filings
| Item | Value |
|---|---|
| Employees | 4,689 |
| Average monthly overtime (statutory overtime plus work on statutory days off) |
11.5 hours |
| Share of managers who are women | 10.9% |
Greenhouse gas emissions
| Category | Emissions |
|---|---|
| 特定事業所排出者 | 57,990 t-CO2 |
| Sites covered by the report | 2 |
Audit and disclosure information
| Item | Value |
|---|---|
| Audit firm | EY新日本有限責任監査法人 |
| Going concern note | Cannot be determined |
| Accounting standard | Japanese GAAP |
Sources and methodology
Retrieved disclosed figures
Major management indicators (5 years) (27 items)
| Item | Value | Consolidated / Non-consolidated |
|---|---|---|
| Comprehensive income | ¥131.5 billion | Consolidated |
| Net cash provided by (used in) operating activities | ¥95.0 billion | Consolidated |
| Net sales | ¥992.6 billion | Consolidated |
| Net cash provided by (used in) investing activities | ¥-230.7 billion | Consolidated |
| Cash and cash equivalents | ¥382.5 billion | Consolidated |
| Net assets | ¥1,285.6 billion | Consolidated |
| Ordinary income (loss) | ¥54.5 billion | Consolidated |
| Total assets | ¥1,845.1 billion | Consolidated |
| Return on equity | 2.8% | Consolidated |
| Equity-to-asset ratio | 65.4% | Consolidated |
| Net income (loss) attributable to owners of parent | ¥31.7 billion | Consolidated |
| Net cash provided by (used in) financing activities | ¥141.7 billion | Consolidated |
| Basic earnings (loss) per share | 26,416 yen | Consolidated |
| Net assets per share | 1,007,190 yen | Consolidated |
| Dividend per share | 3,400 yen | Parent only |
| Net sales | ¥112.8 billion | Parent only |
| Net income (loss) | ¥17.8 billion | Parent only |
| Total number of issued shares (common stock) | 1,199,240.05 shares | Parent only |
| Net assets | ¥451.9 billion | Parent only |
| Ordinary income (loss) | ¥20.6 billion | Parent only |
| Total assets | ¥722.3 billion | Parent only |
| Return on equity | 4.0% | Parent only |
| Equity-to-asset ratio | 62.6% | Parent only |
| Capital stock | ¥12.0 billion | Parent only |
| Payout ratio | 23.0% | Parent only |
| Basic earnings (loss) per share | 14,807 yen | Parent only |
| Net assets per share | 376,957 yen | Parent only |
Employees (2 items)
| Item | Value | Consolidated / Non-consolidated |
|---|---|---|
| Number of employees | 56,899 people | Consolidated |
| Number of employees | 4,491 people | Parent only |
Other disclosed items (7 items)
| Item | Value | Consolidated / Non-consolidated |
|---|---|---|
| Net sales to external customers | ¥992.6 billion | Consolidated |
| Average number of temporary employees | 1,927 people | Consolidated |
| Number of associates accounted for using equity method | 1 companies | Consolidated |
| Increase in property plant and equipment and intangible assets | ¥90.0 billion | Consolidated |
| Write-downs of inventories | ¥0.3 billion | Consolidated |
| Depreciation | ¥69.3 billion | Consolidated |
| Number of consolidated subsidiaries | 140 companies | Consolidated |
Shares (2 items)
| Item | Value | Consolidated / Non-consolidated |
|---|---|---|
| Number of shares held | 714,977.55 shares | Consolidated |
| Shareholding ratio | 59.7% | Consolidated |
Balance sheet (131 items)
| Item | Value | Consolidated / Non-consolidated |
|---|---|---|
| Other | ¥29.8 billion | Consolidated |
| Other | ¥23.3 billion | Consolidated |
| Other | ¥217.5 billion | Consolidated |
| Other | ¥128.4 billion | Consolidated |
| Other | ¥58.2 billion | Consolidated |
| Other | ¥41.5 billion | Consolidated |
| Valuation difference on available-for-sale securities | ¥32.2 billion | Consolidated |
| Other, net | ¥57.3 billion | Consolidated |
| Goodwill | ¥84.8 billion | Consolidated |
| Goodwill | ¥84.8 billion | Consolidated |
| Work in process | ¥98.9 billion | Consolidated |
| Retained earnings | ¥912.5 billion | Consolidated |
| Raw materials and supplies | ¥100.4 billion | Consolidated |
| Notes receivable - trade | ¥55.6 billion | Consolidated |
| Notes receivable - trade | ¥278.7 billion | Consolidated |
| Merchandise and finished goods | ¥62.5 billion | Consolidated |
| Non-current liabilities | ¥226.8 billion | Consolidated |
| Non-current assets | ¥843.9 billion | Consolidated |
| Land | ¥82.1 billion | Consolidated |
| Accounts receivable - trade | ¥207.4 billion | Consolidated |
| Buildings and structures | ¥634.5 billion | Consolidated |
| Buildings and structures, net | ¥209.0 billion | Consolidated |
| Construction in progress | ¥34.2 billion | Consolidated |
| Deposits received from employees | ¥35.7 billion | Consolidated |
| Investments and other assets | ¥153.7 billion | Consolidated |
| Investment securities | ¥73.8 billion | Consolidated |
| Notes and accounts payable - trade | ¥102.7 billion | Consolidated |
| Securities | ¥1.0 billion | Consolidated |
| Property, plant and equipment | ¥563.9 billion | Consolidated |
| Income taxes payable | ¥9.9 billion | Consolidated |
| Shareholders' equity | ¥959.9 billion | Consolidated |
| Inventories | ¥261.8 billion | Consolidated |
| Machinery, equipment and vehicles | ¥1,021.4 billion | Consolidated |
| Machinery, equipment and vehicles, net | ¥181.3 billion | Consolidated |
| Current liabilities | ¥332.7 billion | Consolidated |
| Current assets | ¥1,001.3 billion | Consolidated |
| Accumulated depreciation | ¥-160.2 billion | Consolidated |
| Accumulated depreciation | ¥-425.5 billion | Consolidated |
| Accumulated depreciation | ¥-840.1 billion | Consolidated |
| Foreign currency translation adjustment | ¥167.5 billion | Consolidated |
| Intangible assets | ¥126.2 billion | Consolidated |
| Cash and cash equivalents | ¥382.5 billion | Consolidated |
| Cash and deposits | ¥405.6 billion | Consolidated |
| Short-term loans payable | ¥4.8 billion | Consolidated |
| Bonds payable | ¥20.0 billion | Consolidated |
| Net assets | ¥1,285.6 billion | Consolidated |
| Net assets | ¥1,285.6 billion | Consolidated |
| Total assets | ¥1,845.1 billion | Consolidated |
| Total assets | ¥1,845.1 billion | Consolidated |
| Deferred gains or losses on hedges | ¥2.5 billion | Consolidated |
| Deferred tax liabilities | ¥25.2 billion | Consolidated |
| Deferred tax assets | ¥14.6 billion | Consolidated |
| Treasury stock | ¥-32.00 million | Consolidated |
| Valuation and translation adjustments | ¥247.5 billion | Consolidated |
| Liabilities | ¥559.5 billion | Consolidated |
| Liabilities and net assets | ¥1,845.1 billion | Consolidated |
| Allowance for doubtful accounts | ¥-1.1 billion | Consolidated |
| Allowance for doubtful accounts | ¥-4.0 billion | Consolidated |
| Capital surplus | ¥35.4 billion | Consolidated |
| Capital stock | ¥12.0 billion | Consolidated |
| Provision for bonuses | ¥35.0 billion | Consolidated |
| Remeasurements of defined benefit plans | ¥45.3 billion | Consolidated |
| Net defined benefit liability | ¥13.7 billion | Consolidated |
| Net defined benefit asset | ¥43.1 billion | Consolidated |
| Long-term loans payable | ¥138.0 billion | Consolidated |
| Non-controlling interests | ¥78.3 billion | Consolidated |
| Current portion of long-term loans payable | ¥16.2 billion | Consolidated |
| Other | ¥25.5 billion | Parent only |
| Other | ¥2.4 billion | Parent only |
| Other | ¥1.9 billion | Parent only |
| Other | ¥34.2 billion | Parent only |
| Other | ¥1.7 billion | Parent only |
| Valuation difference on available-for-sale securities | ¥17.7 billion | Parent only |
| Software | ¥3.4 billion | Parent only |
| Work in process | ¥14.2 billion | Parent only |
| General reserve | ¥351.2 billion | Parent only |
| Retained earnings | ¥386.9 billion | Parent only |
| Legal retained earnings | ¥2.7 billion | Parent only |
| Raw materials and supplies | ¥7.3 billion | Parent only |
| Notes receivable - trade | ¥1.7 billion | Parent only |
| Merchandise and finished goods | ¥2.3 billion | Parent only |
| Non-current liabilities | ¥195.6 billion | Parent only |
| Non-current assets | ¥547.2 billion | Parent only |
| Land | ¥17.5 billion | Parent only |
| Accounts receivable - trade | ¥15.7 billion | Parent only |
| Tools, furniture and fixtures | ¥3.9 billion | Parent only |
| Buildings, net | ¥33.4 billion | Parent only |
| Construction in progress | ¥2.8 billion | Parent only |
| Deposits received from employees | ¥11.2 billion | Parent only |
| Investments and other assets | ¥459.4 billion | Parent only |
| Investment securities | ¥30.7 billion | Parent only |
| Notes payable trade | ¥1.3 billion | Parent only |
| Property, plant and equipment | ¥82.8 billion | Parent only |
| Income taxes payable | ¥2.2 billion | Parent only |
| Accrued expenses | ¥2.7 billion | Parent only |
| Accounts payable - other | ¥8.2 billion | Parent only |
| Shareholders' equity | ¥434.2 billion | Parent only |
| Structures, net | ¥7.0 billion | Parent only |
| Machinery and equipment, net | ¥17.6 billion | Parent only |
| Current liabilities | ¥74.8 billion | Parent only |
| Current assets | ¥175.1 billion | Parent only |
| Intangible assets | ¥5.1 billion | Parent only |
| Cash and deposits | ¥75.4 billion | Parent only |
| Short-term loans payable | ¥4.5 billion | Parent only |
| Short-term loans receivable with resale agreement | ¥25.0 billion | Parent only |
| Bonds payable | ¥20.0 billion | Parent only |
| Net assets | ¥451.9 billion | Parent only |
| Net assets | ¥451.9 billion | Parent only |
| Total assets | ¥722.3 billion | Parent only |
| Deferred tax liabilities | ¥2.2 billion | Parent only |
| Retained earnings brought forward | ¥21.7 billion | Parent only |
| Treasury stock | ¥-32.00 million | Parent only |
| Valuation and translation adjustments | ¥17.7 billion | Parent only |
| Liabilities | ¥270.4 billion | Parent only |
| Liabilities and net assets | ¥722.3 billion | Parent only |
| Accounts payable - trade | ¥5.2 billion | Parent only |
| Reserve for reduction entry of replaced property | ¥6.00 million | Parent only |
| Allowance for doubtful accounts | ¥-10.00 million | Parent only |
| Allowance for doubtful accounts | ¥-0.8 billion | Parent only |
| Capital surplus | ¥35.3 billion | Parent only |
| Legal capital surplus | ¥35.3 billion | Parent only |
| Capital stock | ¥12.0 billion | Parent only |
| Provision for bonuses | ¥5.6 billion | Parent only |
| Vehicles, net | ¥0.5 billion | Parent only |
| Provision for retirement benefits | ¥10.2 billion | Parent only |
| Reserve for dividends3 | ¥3.9 billion | Parent only |
| Long-term loans payable | ¥137.7 billion | Parent only |
| Shares of subsidiaries and associates | ¥248.6 billion | Parent only |
| Long-term loans receivable from subsidiaries and affiliates | ¥177.7 billion | Parent only |
| Deposits received | ¥15.8 billion | Parent only |
| Current portion of long-term loans payable | ¥16.2 billion | Parent only |
Statement of income (93 items)
| Item | Value | Consolidated / Non-consolidated |
|---|---|---|
| Other | ¥5.3 billion | Consolidated |
| Other | ¥3.6 billion | Consolidated |
| Other | ¥60.00 million | Consolidated |
| Other | ¥1.1 billion | Consolidated |
| Other comprehensive income | ¥98.3 billion | Consolidated |
| Valuation difference on available for sale securities net of tax | ¥11.9 billion | Consolidated |
| Amortization of goodwill | ¥0.9 billion | Consolidated |
| Amortization of goodwill | ¥0.9 billion | Consolidated |
| Dividends from surplus | ¥-3.8 billion | Consolidated |
| Comprehensive income | ¥131.5 billion | Consolidated |
| Interest income | ¥7.0 billion | Consolidated |
| Dividend income | ¥1.1 billion | Consolidated |
| Operating income | ¥46.8 billion | Consolidated |
| Operating income | ¥46.8 billion | Consolidated |
| Non-operating income | ¥14.8 billion | Consolidated |
| Non-operating expenses | ¥7.1 billion | Consolidated |
| Net cash provided by (used in) operating activities | ¥95.0 billion | Consolidated |
| Loss on sale of non-current assets | ¥0.1 billion | Consolidated |
| Gain on sales of non-current assets | ¥5.6 billion | Consolidated |
| Loss on retirement of non-current assets | ¥2.5 billion | Consolidated |
| Cost of sales | ¥647.2 billion | Consolidated |
| Gross profit (loss) | ¥345.3 billion | Consolidated |
| Net sales | ¥992.6 billion | Consolidated |
| Net sales | ¥992.6 billion | Consolidated |
| Net income | ¥31.7 billion | Consolidated |
| Net income | ¥31.7 billion | Consolidated |
| Net income (loss) | ¥33.2 billion | Consolidated |
| Net income (loss) | ¥33.2 billion | Consolidated |
| Provision for directors' retirement benefits | ¥15.00 million | Consolidated |
| Employees' salaries and allowances | ¥113.5 billion | Consolidated |
| Net cash provided by (used in) investing activities | ¥-230.7 billion | Consolidated |
| Interest expenses | ¥1.4 billion | Consolidated |
| Commission fees | ¥0.9 billion | Consolidated |
| Income taxes - current | ¥18.8 billion | Consolidated |
| Income taxes | ¥20.2 billion | Consolidated |
| Income taxes - deferred | ¥1.4 billion | Consolidated |
| Impairment loss | ¥2.9 billion | Consolidated |
| Impairment loss | ¥2.9 billion | Consolidated |
| Foreign exchange gains | ¥1.4 billion | Consolidated |
| Foreign currency translation adjustment net of tax | ¥63.0 billion | Consolidated |
| Extraordinary income | ¥5.7 billion | Consolidated |
| Extraordinary loss | ¥6.7 billion | Consolidated |
| Effect of exchange rate change on cash and cash equivalents | ¥23.1 billion | Consolidated |
| Net increase (decrease) in cash and cash equivalents | ¥29.2 billion | Consolidated |
| Income (loss) before income taxes | ¥53.4 billion | Consolidated |
| Income (loss) before income taxes | ¥53.4 billion | Consolidated |
| Ordinary income | ¥54.5 billion | Consolidated |
| Deferred gains or losses on hedges net of tax | ¥1.7 billion | Consolidated |
| Purchase of treasury stock | ¥-2.00 million | Consolidated |
| Packing and transportation expenses | ¥31.8 billion | Consolidated |
| Comprehensive income attributable to owners of parent | ¥127.8 billion | Consolidated |
| Net cash provided by (used in) financing activities | ¥141.7 billion | Consolidated |
| Selling, general and administrative expenses | ¥298.5 billion | Consolidated |
| Provision of allowance for doubtful accounts | ¥-87.00 million | Consolidated |
| Provision for bonuses | ¥14.2 billion | Consolidated |
| Remeasurements of defined benefit plans net of tax | ¥21.7 billion | Consolidated |
| Retirement benefit expenses | ¥9.4 billion | Consolidated |
| Changes in equity of parent from transaction of non controlling interest | ¥-1.00 million | Consolidated |
| Comprehensive income attributable to non-controlling interests | ¥3.7 billion | Consolidated |
| Net income (loss) attributable to non-controlling interests | ¥1.6 billion | Consolidated |
| Other | ¥0.4 billion | Parent only |
| Other | ¥0.4 billion | Parent only |
| Other | ¥56.00 million | Parent only |
| Dividends from surplus | ¥-3.8 billion | Parent only |
| Interest and dividend income | ¥26.4 billion | Parent only |
| Operating income | ¥-7.0 billion | Parent only |
| Non-operating income | ¥31.1 billion | Parent only |
| Non-operating expenses | ¥3.4 billion | Parent only |
| Gain on sales of non-current assets | ¥0 | Parent only |
| Fixed asset rent | ¥3.0 billion | Parent only |
| Rent expenses on non-current assets | ¥2.3 billion | Parent only |
| Loss on sales and retirement of noncurrent assets | ¥1.2 billion | Parent only |
| Cost of sales | ¥73.5 billion | Parent only |
| Gross profit (loss) | ¥39.3 billion | Parent only |
| Net sales | ¥112.8 billion | Parent only |
| Net income (loss) | ¥17.8 billion | Parent only |
| Net income (loss) | ¥17.8 billion | Parent only |
| Employees' salaries and allowances | ¥16.1 billion | Parent only |
| Interest expenses | ¥0.8 billion | Parent only |
| Commission fees | ¥7.8 billion | Parent only |
| Income taxes - current | ¥1.0 billion | Parent only |
| Income taxes | ¥1.6 billion | Parent only |
| Income taxes - deferred | ¥0.6 billion | Parent only |
| Depreciation | ¥4.2 billion | Parent only |
| Foreign exchange gains | ¥1.3 billion | Parent only |
| Extraordinary income | ¥0 | Parent only |
| Extraordinary loss | ¥1.3 billion | Parent only |
| Income (loss) before income taxes | ¥19.4 billion | Parent only |
| Ordinary income | ¥20.6 billion | Parent only |
| Purchase of treasury stock | ¥-2.00 million | Parent only |
| Selling, general and administrative expenses | ¥46.3 billion | Parent only |
| Provision for bonuses | ¥3.6 billion | Parent only |
| Retirement benefit expenses | ¥2.2 billion | Parent only |
Accounts unique to this company (4 items)
| Item | Value | Consolidated / Non-consolidated |
|---|---|---|
| Revenue | ¥0.3 billion | Consolidated |
| Revenue | ¥0.9 billion | Consolidated |
| Revenue | ¥0.3 billion | Consolidated |
| Revenue | ¥7.5 billion | Parent only |
Statement of changes in equity (4 items)
| Item | Value | Consolidated / Non-consolidated |
|---|---|---|
| Total changes during the period | ¥178.7 billion | Consolidated |
| Net changes in items other than shareholders' equity | ¥150.8 billion | Consolidated |
| Total changes during the period | ¥20.3 billion | Parent only |
| Net changes in items other than shareholders' equity | ¥6.3 billion | Parent only |
Statement of cash flows (33 items)
| Item | Value | Consolidated / Non-consolidated |
|---|---|---|
| Other | ¥-1.1 billion | Consolidated |
| Other | ¥-72.00 million | Consolidated |
| Other | ¥-34.00 million | Consolidated |
| Repayments of finance lease obligations | ¥-4.4 billion | Consolidated |
| Increase decrease in notes and accounts payable trade | ¥-3.1 billion | Consolidated |
| Interest expenses paid | ¥-1.2 billion | Consolidated |
| Interest and dividends income received | ¥8.6 billion | Consolidated |
| Interest and dividend income | ¥-8.1 billion | Consolidated |
| Decrease increase in notes and accounts receivable trade | ¥14.0 billion | Consolidated |
| Proceeds from withdrawal of time deposits | ¥13.0 billion | Consolidated |
| Payments into time deposits | ¥-15.3 billion | Consolidated |
| Subtotal | ¥107.5 billion | Consolidated |
| Purchase of investment securities | ¥-1.0 billion | Consolidated |
| Interest expenses | ¥1.4 billion | Consolidated |
| Purchase of property plant and equipment | ¥-80.1 billion | Consolidated |
| Proceeds from sales of property plant and equipment | ¥6.3 billion | Consolidated |
| Loss gain on sales of property plant and equipment | ¥-5.5 billion | Consolidated |
| Loss on retirement of property, plant and equipment | ¥1.0 billion | Consolidated |
| Decrease (increase) in inventories | ¥-16.6 billion | Consolidated |
| Income taxes paid | ¥-19.9 billion | Consolidated |
| Depreciation | ¥69.3 billion | Consolidated |
| Impairment loss | ¥2.9 billion | Consolidated |
| Purchase of intangible assets | ¥-6.4 billion | Consolidated |
| Decrease/increase in short-term loans payable | ¥-0.9 billion | Consolidated |
| Net decrease increase in short term loans receivable | ¥14.00 million | Consolidated |
| Regarding purchase of treasury stock | ¥-2.00 million | Consolidated |
| Increase (decrease) in allowance for doubtful accounts | ¥0.2 billion | Consolidated |
| Increase (decrease) in net defined benefit liability | ¥-0.6 billion | Consolidated |
| Payments for acquisition in subsidiaries resulting in change in scope of consolidation | ¥-147.1 billion | Consolidated |
| Dividends | ¥-3.8 billion | Consolidated |
| Proceeds from long term loans payable | ¥151.9 billion | Consolidated |
| Repayment of long term loans payable | ¥-15.00 million | Consolidated |
| Dividends paid to non-controlling interests | ¥-0.9 billion | Consolidated |
Research and development (1 items)
| Item | Value | Consolidated / Non-consolidated |
|---|---|---|
| Research and development expenses included in general and administrative expenses and manufacturing cost for current period | ¥30.2 billion | Consolidated |
Basic indicators
| Item | Value | Consolidated / Non-consolidated | Source |
|---|---|---|---|
| Net cash provided by (used in) operating activities | ¥95.0 billion | Consolidated | Disclosed |
| Dividend per share | 3,400 | Parent only | Disclosed |
| Number of employees | 56,899 | Consolidated | Disclosed |
| Net assets | ¥1,285.6 billion | Consolidated | Disclosed |
| Net sales | ¥992.6 billion | Consolidated | Disclosed |
| Operating income | ¥46.8 billion | Consolidated | Disclosed |
| Ordinary income | ¥54.5 billion | Consolidated | Disclosed |
| Net income | ¥31.7 billion | Consolidated | Disclosed |
| Total assets | ¥1,845.1 billion | Consolidated | Disclosed |
| Operating margin | 4.7% | Consolidated | Calculated |
| Net margin | 3.2% | Consolidated | Calculated |
| Sales per employee | 17444261 yen | Consolidated | Calculated |
| Total asset turnover | 0.54 times | Consolidated | Calculated |
| Net assets to total assets | 69.7% | Consolidated | Calculated |