Alphabet
Alphabet Inc.
Company highlights
A company where advertisers pay what the users do not.
Vol.6, Chapter 1 (as of 2026-08-26)
Key figures
Period to 2025-12-31ConsolidatedU.S. GAAP
Business revenue model
Featured in
Vol.6, Chapter 1 (as of 2026-08-26)
“Kaisha no Shikumi: Free”, Chapter 1: Google and LINE Yahoo: One Where Advertisers Pay 73.2%, One That Split the Payers Five Ways
Book’s reference date 2026-08-26 / data last checked 2026-10-20
Key points in this volumeA free service's profits depend not just on how many people use it, but on who pays.
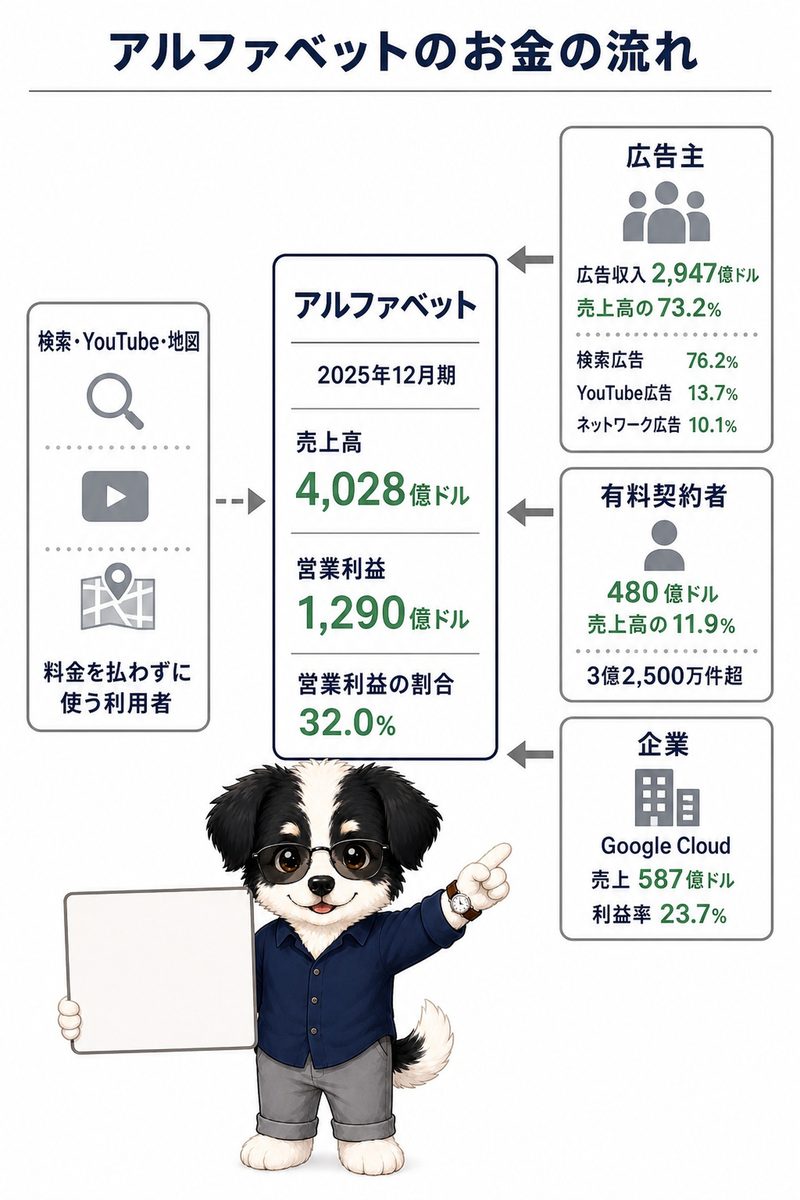
Search, YouTube and Maps cost the user nothing. Of US$402.8 billion in net sales for the year ended December 2025, 73.2% is paid by advertisers. In the year ended December 2018 it was 85.1%.
A free doorway has a cost of its own. Traffic acquisition costs, which include payments to be the default in a search box, were US$59.9 billion, or 20.3% of advertising revenue. Cloud was US$58.7 billion at a 23.7% margin. The company paid no dividend from its listing until it paid one for the first time in 2024.
Coverage in the book
- Search, Maps, and Video Are All Free, and Revenue Is $402.8 Billion
- What Alphabet Makes Its Money From
- Advertising Went from 85.1% of Revenue to 73.2%
- $59.9 Billion Goes to Search Distribution and Partner Sites
- In December 2025, Exclusive Contracts Were Barred
Related books, articles and videos
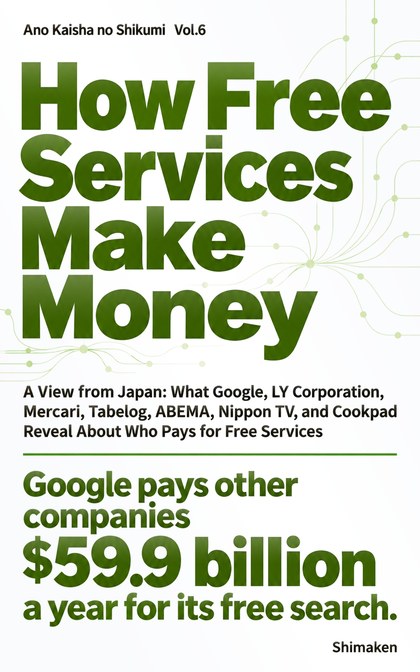 “Kaisha no Shikumi: Free”
Chapter 1: Alphabet
“Google and LINE Yahoo: One Where Advertisers Pay 73.2%, One That Split the Payers Five Ways”
“Ano Kaisha no Shikumi” series, Vol.6 — Kindle and paperback
Find it on Amazon →


Company profile
Tables scroll sideways
Disclosed data
Business activities and revenue composition
Breakdown by business: not published
Revenue and profit
Performance, financial position and capital allocation
Alphabet
Recent performance trends
Source Annual securities reports
Consolidated indicators (6 items)
| Item | 4 years ago | 3 years ago | 2 years ago | Last year | This year |
|---|---|---|---|---|---|
| Net sales | US$257.6 billion | US$282.8 billion | US$307.4 billion | US$350.0 billion | US$402.8 billion |
| Operating income | US$78.7 billion | US$74.8 billion | US$84.3 billion | US$112.4 billion | US$129.0 billion |
| Net income | US$76.0 billion | US$60.0 billion | US$73.8 billion | US$100.1 billion | US$132.2 billion |
| Net cash provided by (used in) operating activities | US$91.7 billion | US$91.5 billion | US$101.7 billion | US$125.3 billion | US$164.7 billion |
| Total assets | US$359.3 billion | US$365.3 billion | US$402.4 billion | US$450.3 billion | US$595.3 billion |
| Net assets | US$251.6 billion | US$256.1 billion | US$283.4 billion | US$325.1 billion | US$415.3 billion |
Revenue scale in the same industry
Industry: not classified (no comparison)
Sources and methodology
Basic indicators
| Item | Value | Consolidated / Non-consolidated | Source |
|---|---|---|---|
| Net sales | US$402.8 billion | Disclosed | |
| Operating income | US$129.0 billion | Disclosed | |
| Net income | US$132.2 billion | Disclosed | |
| Net cash provided by (used in) operating activities | US$164.7 billion | Disclosed | |
| Total assets | US$595.3 billion | Disclosed | |
| Net assets | US$415.3 billion | Disclosed | |
| Operating margin | 32.0% | Consolidated | Calculated |
| Net assets to total assets | 69.8% | Consolidated | Calculated |
| Net margin | 32.8% | Consolidated | Calculated |
| Return on equity | 31.8% | Consolidated | Calculated |