Rakuten Group
Rakuten Group,Inc.
Company highlights
A mall that sells nothing, gathering customers and earning through finance.
Vol.5, Chapter 3 (as of 2026-08-24)
Key figures
Period Jan 2025 to Dec 2025ConsolidatedIFRS
Business revenue model
Featured in
Vol.5, Chapter 3 (as of 2026-08-24)
“Kaisha no Shikumi: Earning Beyond the Till”, Chapter 3: Rakuten: A Mall of 50,000 Shops That Sells No Goods of Its Own
Book’s reference date 2026-08-24 / data last checked 2026-10-20
Key points in this volumeA company's profits depend not just on what it sells, but on who pays, and what they pay for.
Most of the goods listed on Rakuten Ichiba belong to the roughly 50,000 merchants on the platform. What the customer pays goes to the merchant, and what reaches the company is listing fees and sales commissions.
For the year ended December 2025, revenue was ¥2,496.6 billion and operating income ¥14.4 billion, a margin of 0.6%. The fintech business produced ¥199.9 billion of operating income, while the mobile business posted an operating loss of ¥161.8 billion. Simply summed from 2019, that is about ¥1,896.1 billion of losses.
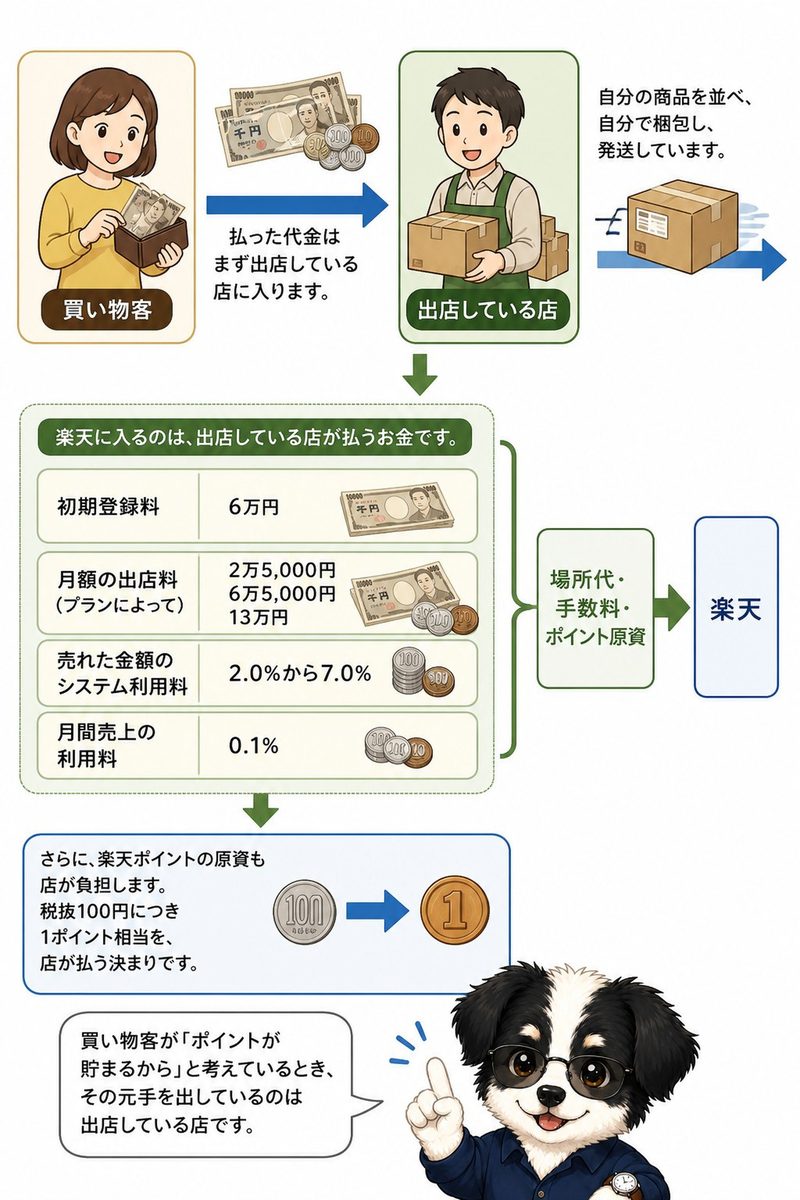
The move that changed Rakuten
Enter mobile phones with a network of its own, and hold the losses inside the same consolidated accounts as the profits of Internet Services and Fintech.
Rakuten's operating profit in the year ended December 2018 was ¥170.4 billion ($1.07 billion), and the dividend was ¥4.5 a share. In 2019 it entered the mobile phone business with a network of its own, and it launched a commercial service in April 2020. Operating profit and loss was negative for four years running from the year ended December 2020 to the year ended December 2023, with an operating loss of ¥371.6 billion in the year ended December 2022. The dividend went to zero in the year ended December 2023 and has stayed there for three years. Adding up the non-GAAP operating losses of the mobile business from the year ended December 2019 to the year ended December 2025 gives about ¥1.8961 trillion, against about ¥805.7 billion of Fintech operating profit over the same period. The total mobile losses are about 2.35 times the total Fintech operating profit.
Coverage in the book
- A Store Fee, and a Fee Based on What Is Sold
- By Business, Finance Made ¥199.9 Billion
- The Shops Pay for the Points
- In 2019 It Entered Mobile Phones With a Network of Its Own
- Rakuten's Ten Fiscal Years, and Its Dividend Policy
Related books, articles and videos
 “Kaisha no Shikumi: Earning Beyond the Till”
Chapter 3: Rakuten Group
“Rakuten: A Mall of 50,000 Shops That Sells No Goods of Its Own”
“Ano Kaisha no Shikumi” series, Vol.5 — Kindle and paperback
Find it on Amazon →


Company profile
Tables scroll sideways
Disclosed data
Business activities and revenue composition
Rakuten Group
Revenue and profit by business segment
Period Jan 2025 to Dec 2025Source Annual securities reportsConsolidated・Disclosed
| Business | Net sales to external customers | ||
|---|---|---|---|
| This year | Share | Last year | |
| Internet Services | ¥1,369.7 billion | 48.4% | ¥1,282.1 billion |
| FinTech | ¥975.9 billion | 34.5% | ¥820.4 billion |
| Mobile | ¥482.8 billion | 17.1% | ¥440.7 billion |
| Total of the businesses | ¥2,828.5 billion | 100.0% | |
Revenue and profit
Amounts by account
| Group | Account | Amount | Consolidated / Non-consolidated |
|---|---|---|---|
| Selling, general and administrative expenses | Personnel expenses | ¥102.5 billion | Parent only |
| Advertising and promotion expenses | ¥93.3 billion | Parent only | |
| Commission fees | ¥87.4 billion | Parent only | |
| Other | ¥62.3 billion | Parent only | |
| Depreciation | ¥51.3 billion | Parent only | |
| Rents | ¥15.2 billion | Parent only | |
| Communication expenses | ¥11.2 billion | Parent only | |
| Provision for shareholder benefit program | ¥8.6 billion | Parent only | |
| Provision for bonuses | ¥6.4 billion | Parent only | |
| Provision for directors' retirement benefits | ¥0.9 billion | Parent only | |
| Provision of allowance for doubtful accounts | ¥0.2 billion | Parent only | |
| Profit by stage | Gross profit (loss) | ¥701.2 billion | Parent only |
| Net income | ¥-177.9 billion | Consolidated | |
| Ordinary income | ¥26.1 billion | Parent only | |
| Operating income | ¥14.4 billion | Consolidated |
Rakuten Group
Selling, general and administrative expenses
Period Jan 2025 to Dec 2025Source Annual securities reports
- Personnel expenses ¥102.5 billion
- Advertising and promotion expenses ¥93.3 billion
- Commission fees ¥87.4 billion
- Other ¥62.3 billion
- Depreciation ¥51.3 billion
- Rents ¥15.2 billion
Performance, financial position and capital allocation
Long-term changes in performance
Rakuten Group
Long-term revenue, profit and asset trends
Period 2012 to 2025Source Annual securities reportsDisclosed
Recent performance trends
Year-on-year comparison
| Item | 2021 | 2022 | 2023 | 2024 | 2025 |
|---|---|---|---|---|---|
| Revenue (IFRS) | ¥1,681.8B | ¥1,920.9B | ¥2,071.3B | ¥2,279.2B | ¥2,496.6B |
| Year on year (%) | +15.5% | +14.2% | +7.8% | +10.0% | +9.5% |
| Profit (loss) before tax (IFRS) | -¥212.6B | -¥415.6B | -¥217.7B | ¥16.3B | -¥29.6B |
| Change from prior year | 1.41x | 1.95x | 0.52x | loss to profit◆ | profit to loss◆ |
| Profit (loss) before tax (IFRS) as a share of Revenue (IFRS) | -12.6% | -21.6% | -10.5% | 0.7% | -1.2% |
| Change (percentage points) | -2.3 points◆ | -9.0 points◆ | +11.1 points◆ | +11.2 points◆ | -1.9 points |
Fiscal periods marked for changes
Earlier fiscal periods (7)
- 2015Profit (loss) before tax (IFRS) as a share of revenue -4.5 points
- 2016Profit (loss) before tax (IFRS) as a share of revenue -3.4 points
- 2017Revenue (IFRS) year on year +20.8%, Profit (loss) before tax (IFRS) as a share of revenue +5.1 points
- 2019Profit (loss) before tax (IFRS) as a share of revenue -18.5 points, Profit (loss) before tax (IFRS) profit to loss
- 2020Profit (loss) before tax (IFRS) as a share of revenue -6.8 points
- 2021Profit (loss) before tax (IFRS) as a share of revenue -2.3 points
- 2022Profit (loss) before tax (IFRS) as a share of revenue -9.0 points
- 2023Profit (loss) before tax (IFRS) as a share of revenue +11.1 points
- 2024Profit (loss) before tax (IFRS) as a share of revenue +11.2 points, Profit (loss) before tax (IFRS) loss to profit
- 2025Profit (loss) before tax (IFRS) profit to loss
Rakuten Group
Earnings and net assets per share over time
Unit yenSource Annual securities reports
Consolidated indicators (15 items)
| Item | 4 years ago | 3 years ago | 2 years ago | Last year | This year |
|---|---|---|---|---|---|
| Revenue (IFRS) | ¥1,681.8 billion | ¥1,920.9 billion | ¥2,071.3 billion | ¥2,279.2 billion | ¥2,496.6 billion |
| Profit (loss) before tax (IFRS) | ¥-212.6 billion | ¥-415.6 billion | ¥-217.7 billion | ¥16.3 billion | ¥-29.6 billion |
| Profit (loss) attributable to owners of parent (IFRS) | ¥-133.8 billion | ¥-377.2 billion | ¥-339.5 billion | ¥-162.4 billion | ¥-177.9 billion |
| Comprehensive income attributable to owners of parent (IFRS) | ¥-73.4 billion | ¥-309.7 billion | ¥-273.8 billion | ¥-85.7 billion | ¥-4.0 billion |
| Equity attributable to owners of parent (IFRS) | ¥1,093.7 billion | ¥791.4 billion | ¥836.6 billion | ¥927.9 billion | ¥992.4 billion |
| Total assets (IFRS) | ¥16,831.2 billion | ¥20,402.3 billion | ¥22,625.6 billion | ¥26,514.7 billion | ¥28,804.4 billion |
| Equity attributable to owners of parent per share (IFRS) | 691.47 yen | 497.56 yen | 390.53 yen | 430.67 yen | 457.33 yen |
| Basic earnings (loss) per share (IFRS) | -87.62 yen | -237.73 yen | -177.27 yen | -75.61 yen | -82.24 yen |
| Diluted earnings (loss) per share (IFRS) | -87.62 yen | -237.89 yen | -177.29 yen | -75.62 yen | -82.26 yen |
| Ratio of equity attributable to owners of parent (IFRS) | 6.5% | 3.9% | 3.7% | 3.5% | 3.4% |
| Return on equity attributable to owners of parent (IFRS) | -15.7% | -40.4% | -41.7% | -18.4% | -18.5% |
| Net cash provided by (used in) operating activities (IFRS) | ¥582.7 billion | ¥-262.1 billion | ¥724.2 billion | ¥1,190.9 billion | ¥424.1 billion |
| Net cash provided by (used in) investing activities (IFRS) | ¥-611.8 billion | ¥-948.3 billion | ¥-597.4 billion | ¥-921.7 billion | ¥-779.8 billion |
| Net cash provided by (used in) financing activities (IFRS) | ¥1,402.3 billion | ¥1,486.7 billion | ¥292.0 billion | ¥757.5 billion | ¥14.1 billion |
| Cash and cash equivalents (IFRS) | ¥4,410.3 billion | ¥4,694.4 billion | ¥5,127.7 billion | ¥6,170.9 billion | ¥5,837.6 billion |
Parent only indicators (14 items)
| Item | 4 years ago | 3 years ago | 2 years ago | Last year | This year |
|---|---|---|---|---|---|
| Net sales | ¥783.3 billion | ¥749.4 billion | ¥860.6 billion | ¥897.7 billion | ¥967.4 billion |
| Ordinary income (loss) | ¥22.7 billion | ¥113.5 billion | ¥133.2 billion | ¥-8.3 billion | ¥26.1 billion |
| Net income (loss) | ¥52.7 billion | ¥-87.2 billion | ¥226.0 billion | ¥249.9 billion | ¥-25.8 billion |
| Capital stock | ¥289.7 billion | ¥294.1 billion | ¥446.8 billion | ¥452.6 billion | ¥459.5 billion |
| Total number of issued shares (common stock) | 1,581,735,100 shares | 1,590,463,000 shares | 2,142,140,300 shares | 2,154,483,600 shares | 2,169,972,100 shares |
| Net assets | ¥803.2 billion | ¥782.3 billion | ¥1,327.4 billion | ¥1,586.9 billion | ¥1,576.9 billion |
| Total assets | ¥3,158.3 billion | ¥3,705.4 billion | ¥4,208.0 billion | ¥5,272.8 billion | ¥4,791.3 billion |
| Net assets per share | 489.68 yen | 471.07 yen | 602.15 yen | 717.08 yen | 706.33 yen |
| Dividend per share | 4.5 yen | 4.5 yen | Could not be retrieved | Could not be retrieved | Could not be retrieved |
| Basic earnings (loss) per share | 34.52 yen | -54.96 yen | 118.03 yen | 116.33 yen | -11.91 yen |
| Diluted earnings per share | 33.76 yen | Could not be retrieved | 115.71 yen | 113.11 yen | Could not be retrieved |
| Equity-to-asset ratio | 24.5% | 20.2% | 30.7% | 29.3% | 32.0% |
| Return on equity | 8.4% | -11.4% | 22.2% | 17.6% | -1.7% |
| Payout ratio | 13.0% | Could not be retrieved | Could not be retrieved | Could not be retrieved | Could not be retrieved |
Dividend history
| Fiscal year | Annual dividend per share | Of which interim | Payout ratio (as reported, parent only) | Flag |
|---|---|---|---|---|
| FY ending 12/2022 | ¥4.5 | Could not be retrieved | Could not be retrieved | |
| FY ending 12/2021 | ¥4.5 | Could not be retrieved | 13.0% | |
| FY ending 12/2020 | ¥4.5 | Could not be retrieved | 11.4% | |
| FY ending 12/2019 | ¥4.5 | Could not be retrieved | 38.6% | |
| FY ending 12/2018 | ¥4.5 | Could not be retrieved | 6.5% | |
| FY ending 12/2017 | ¥4.5 | Could not be retrieved | 10.1% | |
| FY ending 12/2016 | ¥4.5 | Could not be retrieved | 16.5% | |
| FY ending 12/2015 | ¥4.5 | Could not be retrieved | Could not be retrieved | |
| FY ending 12/2014 | ¥4.5 | Could not be retrieved | 9.1% | |
| FY ending 12/2013 | ¥4 | Could not be retrieved | 16.4% | |
| FY ending 12/2012 | ¥3 | Could not be retrieved | 12.0% | Stock split or share consolidation noted |
Rakuten Group
Dividends per share over time
Unit yenSource Annual securities reports
Shareholder composition
Share ownership by holder category
Rakuten Group
Unit %Source Annual securities reports
- Financial institutions14.49%
- Securities firms0.44%
- Other corporations22.26%
- Foreign holders (institutions)36.14%
- Foreign holders (individuals)0.54%
- Individuals and others26.12%
- Government and municipalities0.01%
Major shareholders
| Rank | Shareholder | Shareholding ratio | Shares held |
|---|---|---|---|
| 1 | 日本マスタートラスト信託銀行株式会社(信託口) | 10.84% | 235,173,200 |
| 2 | 合同会社クリムゾングループ | 10.43% | 226,419,000 |
| 3 | 三木谷 浩史 | 8.14% | 176,703,400 |
| 4 | 日本郵政株式会社 | 6.04% | 131,004,000 |
| 5 | 三木谷 晴子 | 5.19% | 112,625,000 |
| 6 | MSIP CLIENT SECURITIES(常任代理人 モルガン・スタンレーMUFG証券株式会社) | 3.78% | 81,941,532 |
| 7 | 株式会社日本カストディ銀行(信託口) | 2.7% | 58,679,800 |
| 8 | GOLDMAN SACHS INTERNATIONAL(常任代理人 ゴールドマン・サックス証券株式会社) | 2.33% | 50,495,231 |
| 9 | BNY GCM CLIENT ACCOUNT JPRD AC ISG(FE-AC)(常任代理人 株式会社三菱UFJ銀行) | 2.08% | 45,192,968 |
| 10 | 有限会社三木谷興産 | 1.88% | 40,868,500 |
| 11 | 有限会社スピリット | 1.88% | 40,868,500 |
Research and development expenses and capital expenditure
| Fiscal year | Research and development | Capital expenditure |
|---|---|---|
| FY ending 12/2025 | ¥21.9 billion | ¥287.3 billion |
| FY ending 12/2020 | ¥10.5 billion | ¥506.3 billion |
Revenue scale in the same industry
Rakuten Group
Source Annual securities reports of each company
Services: 671 companies · revenue · largest first・each company’s latest fiscal year・Consolidated・Disclosed
- 1 RecruitFY Mar 2026 ¥3.7T
- 2 Sumitomo Mitsui Finance and LeasingFY Mar 2026 ¥2.6T
- 3 Rakuten GroupThis companyFY Dec 2025 ¥2.5T
- 4 PERSOLFY Mar 2026 ¥1.6T
- 5 DENTSU GROUPFY Dec 2025 ¥1.4T
- … 666 companies
Workforce information
Women 4,612 Employees by gender
Administrative filings and published information
Workplace information filings
| Item | Value |
|---|---|
| Employees | 10,916 |
| Childcare leave taken, men |
73.5% |
| Childcare leave taken, women |
96.3% |
| Share of managers who are women | 33.5% |
Subsidy award information
| Date approved | Subsidy | Ministry | Amount |
|---|---|---|---|
| 2023-06-19 | 農山漁村振興交付金 | 農林水産省 | ¥60.00 million |
| 2023-04-26 | 森林・林業・木材産業グリーン成長総合対策/カーボンニュートラル実現に向けた国民運動展開対策/木づかい運動」の促進/木材利用拡大の機運醸成を促す取組 | 林野庁 | ¥11.00 million |
| 2022-12-26 | 令和4年度省エネルギー促進に向けた広報事業(省エネルギー普及促進に向けた広報事業) | 資源エネルギー庁 | ¥14.65 million |
| 2022-06-15 | 農山漁村振興交付金 | 農林水産省 | ¥50.00 million |
| 2022-04-26 | 森林・林業・木材産業グリーン成長総合対策/カーボンニュートラル実現に向けた国民運動展開対策/「木づかい運動」の促進/木材利用による脱炭素社会の実現に向けた国民運動の展開(身近な木材利用等の普及啓発) | 農林水産省 | ¥28.00 million |
| 2022-03-31 | 日本産酒類海外展開支援事業 | 財務省 | ¥2.41 million |
| 2020-05-21 | 鳥獣被害防止総合対策推進交付金 | 農林水産省 | ¥57.40 million |
| 2020-05-11 | 林業成長産業化総合対策/木材需要の創出・輸出力強化対策/ウッド・チェンジにつながる木材利用の理解醸成/木材利用の良さや意義を伝える普及啓発 | 農林水産省 | ¥29.24 million |
Greenhouse gas emissions
| Category | Emissions |
|---|---|
| 特定事業所排出者 | 12,532 t-CO2 |
| Sites covered by the report | 1 |
Audit and disclosure information
| Item | Value |
|---|---|
| Audit firm | EY新日本有限責任監査法人 |
| Audit fees (this year, total) | ¥1.0 billion |
| Non-audit fees (this year, total) | ¥93.00 million |
| Audit fees (this year, network firms) | ¥0.5 billion |
| Non-audit fees (this year, network firms) | ¥0.2 billion |
| Going concern note | Cannot be determined |
| Accounting standard | IFRS |
Sources and methodology
Retrieved disclosed figures
Major management indicators (5 years) (26 items)
| Item | Value | Consolidated / Non-consolidated |
|---|---|---|
| Net cash provided by (used in) operating activities (IFRS) | ¥424.1 billion | Consolidated |
| Basic earnings (loss) per share (IFRS) | -82.24 yen | Consolidated |
| Revenue (IFRS) | ¥2,496.6 billion | Consolidated |
| Diluted earnings (loss) per share (IFRS) | -82.26 yen | Consolidated |
| Profit (loss) attributable to owners of parent (IFRS) | ¥-177.9 billion | Consolidated |
| Comprehensive income attributable to owners of parent (IFRS) | ¥-4.0 billion | Consolidated |
| Net cash provided by (used in) investing activities (IFRS) | ¥-779.8 billion | Consolidated |
| Cash and cash equivalents (IFRS) | ¥5,837.6 billion | Consolidated |
| Profit (loss) before tax (IFRS) | ¥-29.6 billion | Consolidated |
| Total assets (IFRS) | ¥28,804.4 billion | Consolidated |
| Equity attributable to owners of parent (IFRS) | ¥992.4 billion | Consolidated |
| Return on equity attributable to owners of parent (IFRS) | -18.5% | Consolidated |
| Ratio of equity attributable to owners of parent (IFRS) | 3.4% | Consolidated |
| Net cash provided by (used in) financing activities (IFRS) | ¥14.1 billion | Consolidated |
| Equity attributable to owners of parent per share (IFRS) | 457.33 yen | Consolidated |
| Net sales | ¥967.4 billion | Parent only |
| Net income (loss) | ¥-25.8 billion | Parent only |
| Total number of issued shares (common stock) | 2,169,972,100 shares | Parent only |
| Net assets | ¥1,576.9 billion | Parent only |
| Ordinary income (loss) | ¥26.1 billion | Parent only |
| Total assets | ¥4,791.3 billion | Parent only |
| Return on equity | -1.7% | Parent only |
| Equity-to-asset ratio | 32.0% | Parent only |
| Capital stock | ¥459.5 billion | Parent only |
| Basic earnings (loss) per share | -11.91 yen | Parent only |
| Net assets per share | 706.33 yen | Parent only |
Employees (11 items)
| Item | Value | Consolidated / Non-consolidated |
|---|---|---|
| Number of employees | 29,419 people | Consolidated |
| Number of employees | 29,419 people | Consolidated |
| Wage gap between men and women (all employees) | 78.0% | Parent only |
| Average length of service (years) | 6.3 years | Parent only |
| Average annual salary | ¥8.51 million | Parent only |
| Average age (years) | 36 years old | Parent only |
| Number of employees | 9,989 people | Parent only |
| Number of employees | 9,989 people | Parent only |
| Number of employees | 9,989 people | Parent only |
| Wage gap between men and women (regular employees) | 81.6% | Parent only |
| Wage gap between men and women (non-regular employees) | 58.9% | Parent only |
Shares (18 items)
| Item | Value | Consolidated / Non-consolidated |
|---|---|---|
| Total of gain loss on sale equity securities other than those not listed investment equity securities held for pure investment reporting company | ¥21.2 billion | Consolidated |
| Number of shares held | 1,199,971,131 shares | Consolidated |
| Total number of shares held treasury shares etc | 5,800 shares | Consolidated |
| Number of issues whose number of shares decreased shares not listed investment shares held for purposes other than pure investment reporting company | 1 issues | Consolidated |
| Total sale amount for decreased shares shares not listed investment shares held for purposes other than pure investment reporting company | ¥8.00 million | Consolidated |
| Number of shares | 2,169,972,100 shares | Consolidated |
| Shareholding ratio treasury shares etc | 0.0% | Consolidated |
| Shareholding ratio | 55.3% | Consolidated |
| Number of shares held in own name treasury shares etc | 5,800 shares | Consolidated |
| Total of valuation gain (loss) | ¥1.1 billion | Consolidated |
| Number of voting rights | 21,693,754 units | Consolidated |
| Carrying amount on the balance sheet | ¥0.5 billion | Consolidated |
| Carrying amount on the balance sheet | ¥0.2 billion | Consolidated |
| Book value equity securities other than those not listed investment equity securities held for pure investment reporting company | ¥1.5 billion | Consolidated |
| Number of issues | 8 issues | Consolidated |
| Number of issues | 1 issues | Consolidated |
| Number of issues | 1 issues | Consolidated |
| Total shareholder return | 101.9% | Parent only |
Other disclosed items (3 items)
| Item | Value | Consolidated / Non-consolidated |
|---|---|---|
| Rate of male employees taking childcare leave (all employees) | 73.3% | Parent only |
| Total return on the share price index | 213.2% | Parent only |
| Ratio of female employees in managerial positions | 33.5% | Parent only |
Research and development (1 items)
| Item | Value | Consolidated / Non-consolidated |
|---|---|---|
| Research and development expenses | ¥21.9 billion | Consolidated |
Property and facilities (1 items)
| Item | Value | Consolidated / Non-consolidated |
|---|---|---|
| Capital expenditures | ¥287.3 billion | Consolidated |
Audit (11 items)
| Item | Value | Consolidated / Non-consolidated |
|---|---|---|
| Fees for audit and attestation services - reporting company | ¥0.3 billion | Consolidated |
| Fees for audit and attestation services - total | ¥0.5 billion | Consolidated |
| Fees for audit and attestation services - total | ¥1.0 billion | Consolidated |
| Fees for audit and attestation services - consolidated subsidiaries | ¥0.5 billion | Consolidated |
| Fees for audit and attestation services - consolidated subsidiaries | ¥0.6 billion | Consolidated |
| Fees for non-audit services - reporting company | ¥3.00 million | Consolidated |
| Fees for non-audit services - reporting company | ¥31.00 million | Consolidated |
| Fees for non-audit services - total | ¥0.2 billion | Consolidated |
| Fees for non-audit services - total | ¥93.00 million | Consolidated |
| Non audit fees consolidated subsidiaries network firms | ¥0.2 billion | Consolidated |
| Non audit fees consolidated subsidiaries | ¥62.00 million | Consolidated |
Balance sheet (139 items)
| Item | Value | Consolidated / Non-consolidated |
|---|---|---|
| Other | ¥96.9 billion | Consolidated |
| Other | ¥-24.5 billion | Consolidated |
| Other | ¥72.3 billion | Consolidated |
| Other | ¥-137.1 billion | Consolidated |
| Other | ¥256.1 billion | Consolidated |
| Other | ¥119.0 billion | Consolidated |
| Other current liabilities | ¥229.3 billion | Consolidated |
| Other components of equity IFRS | ¥430.9 billion | Consolidated |
| Other current assets | ¥484.8 billion | Consolidated |
| Other financial liabilities | ¥1,551.6 billion | Consolidated |
| Other financial assets | ¥1,115.5 billion | Consolidated |
| Goodwill | ¥745.7 billion | Consolidated |
| Goodwill | ¥-98.5 billion | Consolidated |
| Goodwill IFRS | ¥647.2 billion | Consolidated |
| Software | ¥-595.5 billion | Consolidated |
| Software | ¥908.5 billion | Consolidated |
| Software IFRS | ¥313.0 billion | Consolidated |
| Derivative liabilities2 | ¥77.1 billion | Consolidated |
| Derivatives assets | ¥276.7 billion | Consolidated |
| Right-of-use assets, Acquisition cost (IFRS) | ¥649.6 billion | Consolidated |
| Right-of-use assets, Accumulated depreciation and impairment losses (IFRS) | ¥-346.6 billion | Consolidated |
| Right of use assets IFRS | ¥303.0 billion | Consolidated |
| Retained earnings IFRS | ¥-1,036.1 billion | Consolidated |
| Trade receivables2 assets IFRS | ¥443.6 billion | Consolidated |
| Tools, furniture and fixtures | ¥178.5 billion | Consolidated |
| Tools, furniture and fixtures | ¥-109.5 billion | Consolidated |
| Tools, furniture and fixtures | ¥69.0 billion | Consolidated |
| Buildings and accompanying facilities | ¥102.5 billion | Consolidated |
| Buildings and accompanying facilities | ¥-43.8 billion | Consolidated |
| Buildings and accompanying facilities IFRS | ¥58.7 billion | Consolidated |
| Construction in progress | ¥115.3 billion | Consolidated |
| Construction in progress | ¥-0.3 billion | Consolidated |
| Construction in progress IFRS | ¥115.0 billion | Consolidated |
| Provisions liabilities IFRS | ¥391.0 billion | Consolidated |
| Investments accounted for using equity method IFRS | ¥27.1 billion | Consolidated |
| Securities | ¥491.1 billion | Consolidated |
| Property, plant and equipment | ¥1,929.4 billion | Consolidated |
| Property, plant and equipment | ¥-860.9 billion | Consolidated |
| Property plant and equipment IFRS | ¥1,068.5 billion | Consolidated |
| Property plant and equipment IFRS | ¥1,068.5 billion | Consolidated |
| Income taxes payable | ¥43.7 billion | Consolidated |
| Machinery, equipment | ¥786.8 billion | Consolidated |
| Machinery, equipment | ¥-336.3 billion | Consolidated |
| Machinery and equipment IFRS | ¥450.4 billion | Consolidated |
| Intangible assets accumulated amortization and impairment losses IFRS | ¥-831.1 billion | Consolidated |
| Intangible assets acquisition cost IFRS | ¥1,910.3 billion | Consolidated |
| Intangible assets IFRS | ¥1,079.2 billion | Consolidated |
| Intangible assets IFRS | ¥1,079.2 billion | Consolidated |
| Cash and cash equivalents (IFRS) | ¥5,837.6 billion | Consolidated |
| Cash and cash equivalents (IFRS) | ¥5,837.6 billion | Consolidated |
| Bonds and borrowings liabilities IFRS | ¥1,598.1 billion | Consolidated |
| Net assets | ¥1,354.2 billion | Consolidated |
| Net assets | ¥1,354.2 billion | Consolidated |
| Total assets | ¥28,804.4 billion | Consolidated |
| Deferred tax liabilities IFRS | ¥79.8 billion | Consolidated |
| Deferred tax assets IFRS | ¥71.9 billion | Consolidated |
| Treasury shares IFRS | ¥-5.00 million | Consolidated |
| Equity attributable to owners of parent (IFRS) | ¥992.4 billion | Consolidated |
| Liabilities and equity IFRS | ¥28,804.4 billion | Consolidated |
| Liabilities IFRS | ¥27,450.2 billion | Consolidated |
| Capital surplus IFRS | ¥658.5 billion | Consolidated |
| Share capital IFRS | ¥459.5 billion | Consolidated |
| Net defined benefit liability | ¥49.0 billion | Consolidated |
| Non controlling interests IFRS | ¥361.8 billion | Consolidated |
| Other | ¥25.9 billion | Parent only |
| Other | ¥25.9 billion | Parent only |
| Other | ¥6.8 billion | Parent only |
| Other | ¥147.8 billion | Parent only |
| Other | ¥1.4 billion | Parent only |
| Valuation difference on available-for-sale securities | ¥10.0 billion | Parent only |
| Other capital surplus | ¥0.4 billion | Parent only |
| Other, net | ¥1.3 billion | Parent only |
| Goodwill | ¥1.1 billion | Parent only |
| Commercial papers | ¥42.4 billion | Parent only |
| Software | ¥91.4 billion | Parent only |
| Software in progress | ¥14.6 billion | Parent only |
| Reserve for loyalty awards credits | ¥361.1 billion | Parent only |
| Suspense receipt | ¥1.5 billion | Parent only |
| Retained earnings | ¥635.8 billion | Parent only |
| Advances received | ¥6.7 billion | Parent only |
| Prepaid expenses | ¥14.7 billion | Parent only |
| Merchandise | ¥18.4 billion | Parent only |
| Right of trademark | ¥0.3 billion | Parent only |
| Non-current liabilities | ¥1,736.7 billion | Parent only |
| Non-current assets | ¥3,077.0 billion | Parent only |
| Land | ¥13.7 billion | Parent only |
| Accounts receivable - trade | ¥143.8 billion | Parent only |
| Tools, furniture and fixtures | ¥14.8 billion | Parent only |
| Buildings, net | ¥21.9 billion | Parent only |
| Construction in progress | ¥11.6 billion | Parent only |
| Provision for directors' retirement benefits | ¥0.8 billion | Parent only |
| Investments and other assets | ¥2,903.4 billion | Parent only |
| Investment securities | ¥48.3 billion | Parent only |
| Lease and guarantee deposits | ¥10.1 billion | Parent only |
| Subscription rights to shares | ¥44.2 billion | Parent only |
| Property, plant and equipment | ¥63.5 billion | Parent only |
| Accounts receivable - other | ¥431.0 billion | Parent only |
| Income taxes refund receivable | ¥1.8 billion | Parent only |
| Accrued expenses | ¥41.4 billion | Parent only |
| Accounts payable - other | ¥451.4 billion | Parent only |
| Provision for shareholder benefit program | ¥8.2 billion | Parent only |
| Shareholders' equity | ¥1,522.7 billion | Parent only |
| Machinery, equipment and vehicles, net | ¥0.2 billion | Parent only |
| Current liabilities | ¥1,477.7 billion | Parent only |
| Current assets | ¥1,714.3 billion | Parent only |
| Intangible assets | ¥110.0 billion | Parent only |
| Patent right | ¥1.3 billion | Parent only |
| Cash and deposits | ¥397.3 billion | Parent only |
| Short-term loans payable | ¥36.6 billion | Parent only |
| Claims provable in bankruptcy claims provable in rehabilitation and other | ¥5.5 billion | Parent only |
| Bonds payable | ¥1,574.5 billion | Parent only |
| Net assets | ¥1,576.9 billion | Parent only |
| Net assets | ¥1,576.9 billion | Parent only |
| Total assets | ¥4,791.3 billion | Parent only |
| Deferred tax assets | ¥166.2 billion | Parent only |
| Retained earnings brought forward | ¥635.8 billion | Parent only |
| Treasury stock | ¥-5.00 million | Parent only |
| Provision for loss on litigation | ¥7.1 billion | Parent only |
| Valuation and translation adjustments | ¥10.0 billion | Parent only |
| Liabilities | ¥3,214.3 billion | Parent only |
| Liabilities and net assets | ¥4,791.3 billion | Parent only |
| Supplies | ¥0.2 billion | Parent only |
| Accounts payable - trade | ¥45.5 billion | Parent only |
| Allowance for doubtful accounts | ¥-6.8 billion | Parent only |
| Allowance for doubtful accounts | ¥-0.5 billion | Parent only |
| Capital surplus | ¥427.4 billion | Parent only |
| Legal capital surplus | ¥427.0 billion | Parent only |
| Capital stock | ¥459.5 billion | Parent only |
| Asset retirement obligations | ¥12.3 billion | Parent only |
| Provision for bonuses | ¥6.4 billion | Parent only |
| Provision for retirement benefits | ¥29.4 billion | Parent only |
| Long-term loans payable | ¥82.7 billion | Parent only |
| Long-term prepaid expenses | ¥1.1 billion | Parent only |
| Investments in capital of subsidiaries and affiliates | ¥5.0 billion | Parent only |
| Shares of subsidiaries and associates | ¥2,643.2 billion | Parent only |
| Loans receivable to subsidiaries and affiliates | ¥559.7 billion | Parent only |
| Long-term loans receivable from subsidiaries and affiliates | ¥4.9 billion | Parent only |
| Deposits received | ¥404.9 billion | Parent only |
| Current portion of bonds payable | ¥65.0 billion | Parent only |
Accounts unique to this company (82 items)
| Item | Value | Consolidated / Non-consolidated |
|---|---|---|
| Revenue | ¥6,035.2 billion | Consolidated |
| Revenue | ¥3,662.7 billion | Consolidated |
| Revenue | ¥2,567.3 billion | Consolidated |
| Revenue | ¥5,440.5 billion | Consolidated |
| Revenue | ¥202.7 billion | Consolidated |
| Revenue | ¥553.6 billion | Consolidated |
| Revenue | ¥12,741.3 billion | Consolidated |
| Revenue | ¥6,028.0 billion | Consolidated |
| Revenue | ¥269.2 billion | Consolidated |
| Revenue | ¥810.6 billion | Consolidated |
| Revenue | ¥2,891.8 billion | Consolidated |
| Revenue | ¥136.3 billion | Consolidated |
| Revenue | ¥479.7 billion | Consolidated |
| Revenue | ¥169.6 billion | Consolidated |
| Revenue | ¥-5.00 million | Consolidated |
| Revenue | ¥3.8 billion | Consolidated |
| Revenue | ¥-10.7 billion | Consolidated |
| Revenue | ¥0.1 billion | Consolidated |
| Revenue | ¥-1.4 billion | Consolidated |
| Revenue | ¥-1.5 billion | Consolidated |
| Revenue | ¥81.4 billion | Consolidated |
| Revenue | ¥-28.6 billion | Consolidated |
| Revenue | ¥16.2 billion | Consolidated |
| Revenue | ¥-0.8 billion | Consolidated |
| Revenue | ¥110.5 billion | Consolidated |
| Revenue | ¥-165.1 billion | Consolidated |
| Revenue | ¥1,420.3 billion | Consolidated |
| Revenue | ¥-128.1 billion | Consolidated |
| Revenue | ¥-805.2 billion | Consolidated |
| Revenue | ¥87.2 billion | Consolidated |
| Revenue | ¥-823.1 billion | Consolidated |
| Revenue | ¥515.7 billion | Consolidated |
| Revenue | ¥-59.4 billion | Consolidated |
| Revenue | ¥-1.5 billion | Consolidated |
| Revenue | ¥-1,930.9 billion | Consolidated |
| Revenue | ¥1,296.3 billion | Consolidated |
| Revenue | ¥-112.6 billion | Consolidated |
| Revenue | ¥138.5 billion | Consolidated |
| Revenue | ¥34.2 billion | Consolidated |
| Revenue | ¥-13.1 billion | Consolidated |
| Revenue | ¥28.6 billion | Consolidated |
| Revenue | ¥-66.8 billion | Consolidated |
| Revenue | ¥154.2 billion | Consolidated |
| Revenue | ¥15.9 billion | Consolidated |
| Revenue | ¥48.0 billion | Consolidated |
| Revenue | ¥182.1 billion | Consolidated |
| Revenue | ¥-153.1 billion | Consolidated |
| Revenue | ¥159.2 billion | Consolidated |
| Revenue | ¥-30.0 billion | Consolidated |
| Revenue | ¥199.2 billion | Consolidated |
| Revenue | ¥16.9 billion | Consolidated |
| Revenue | ¥-31.3 billion | Consolidated |
| Revenue | ¥80.7 billion | Consolidated |
| Revenue | ¥-18.5 billion | Consolidated |
| Revenue | ¥127.0 billion | Consolidated |
| Revenue | ¥127.0 billion | Consolidated |
| Revenue | ¥292.9 billion | Consolidated |
| Revenue | ¥-20.7 billion | Consolidated |
| Revenue | ¥106.3 billion | Consolidated |
| Revenue | ¥-5.2 billion | Consolidated |
| Revenue | ¥-15.6 billion | Consolidated |
| Revenue | ¥-71.1 billion | Consolidated |
| Revenue | ¥64.3 billion | Consolidated |
| Revenue | ¥131.0 billion | Consolidated |
| Revenue | ¥698.9 billion | Consolidated |
| Revenue | ¥56.8 billion | Consolidated |
| Revenue | ¥31.4 billion | Consolidated |
| Revenue | ¥48.5 billion | Consolidated |
| Revenue | ¥2.3 billion | Consolidated |
| Revenue | ¥5.3 billion | Consolidated |
| Revenue | ¥10.5 billion | Consolidated |
| Revenue | ¥4.4 billion | Consolidated |
| Revenue | ¥3.5 billion | Consolidated |
| Revenue | ¥3.9 billion | Parent only |
| Revenue | ¥18.6 billion | Parent only |
| Revenue | ¥21.2 billion | Parent only |
| Revenue | ¥0.2 billion | Parent only |
| Revenue | ¥113.1 billion | Parent only |
| Revenue | ¥4.6 billion | Parent only |
| Revenue | ¥199.1 billion | Parent only |
| Revenue | ¥0.1 billion | Parent only |
| Revenue | ¥-125.0 billion | Parent only |
Statement of income (116 items)
| Item | Value | Consolidated / Non-consolidated |
|---|---|---|
| Other | ¥9.4 billion | Consolidated |
| Other | ¥17.9 billion | Consolidated |
| Other | ¥262.5 billion | Consolidated |
| Other | ¥-0.5 billion | Consolidated |
| Other | ¥0.5 billion | Consolidated |
| Other | ¥5.5 billion | Consolidated |
| Other comprehensive income IFRS | ¥171.2 billion | Consolidated |
| Other comprehensive income IFRS | ¥171.2 billion | Consolidated |
| Other income IFRS | ¥19.0 billion | Consolidated |
| Other income IFRS | ¥19.0 billion | Consolidated |
| Other expenses IFRS | ¥102.0 billion | Consolidated |
| Other expenses IFRS | ¥102.0 billion | Consolidated |
| Effective portion of cash flow hedges net of tax items that may be reclassified to profit or loss ociifrs | ¥9.9 billion | Consolidated |
| Segment profit loss IFRS | ¥127.0 billion | Consolidated |
| Intersegment revenue IFRS | ¥-331.9 billion | Consolidated |
| Loss on valuation of derivatives IFRS | ¥7.2 billion | Consolidated |
| Gain on valuation of derivatives IFRS | ¥50.7 billion | Consolidated |
| Interest income IFRS | ¥4.3 billion | Consolidated |
| Operating income | ¥14.4 billion | Consolidated |
| Operating income | ¥14.4 billion | Consolidated |
| Net cash provided by (used in) operating activities | ¥424.1 billion | Consolidated |
| Operating expenses IFRS | ¥2,399.2 billion | Consolidated |
| Operating expenses IFRS | ¥2,399.2 billion | Consolidated |
| Gain on sale of fixed assets IFRS | ¥4.4 billion | Consolidated |
| Basic earnings loss per share IFRS | -82.24 yen | Consolidated |
| Net sales | ¥2,496.6 billion | Consolidated |
| Net sales | ¥2,496.6 billion | Consolidated |
| Revenue from external customers IFRS | ¥2,828.5 billion | Consolidated |
| Revenue from external customers IFRS | ¥2,828.5 billion | Consolidated |
| Diluted earnings loss per share IFRS | -82.26 yen | Consolidated |
| Advertising and sales promotion expenses IFRS | ¥344.4 billion | Consolidated |
| Profit loss IFRS | ¥-123.2 billion | Consolidated |
| Profit loss IFRS | ¥-123.2 billion | Consolidated |
| Profit loss IFRS | ¥-123.2 billion | Consolidated |
| Profit loss IFRS | ¥-123.2 billion | Consolidated |
| Comprehensive income (IFRS) | ¥48.0 billion | Consolidated |
| Comprehensive income (IFRS) | ¥48.0 billion | Consolidated |
| Comprehensive income (IFRS) | ¥48.0 billion | Consolidated |
| Net income | ¥-177.9 billion | Consolidated |
| Employee benefit expenses operating expenses IFRS | ¥380.9 billion | Consolidated |
| Total transactions with owners IFRS | ¥67.8 billion | Consolidated |
| Net cash provided by (used in) investing activities (IFRS) | ¥-779.8 billion | Consolidated |
| Share of profit loss of investments accounted for using equity method IFRS | ¥-7.9 billion | Consolidated |
| Share of profit loss of investments accounted for using equity method IFRS | ¥-7.9 billion | Consolidated |
| Interest expenses IFRS | ¥86.7 billion | Consolidated |
| Exercise of share acquisition rights ssifrs | ¥0 | Consolidated |
| Income tax expense IFRS | ¥93.7 billion | Consolidated |
| Depreciation and amortization | ¥335.3 billion | Consolidated |
| Impairment loss | ¥68.3 billion | Consolidated |
| Foreign exchange gain IFRS | ¥1.9 billion | Consolidated |
| Net increase decrease in cash and cash equivalents IFRS | ¥-333.3 billion | Consolidated |
| Effect of exchange rate changes on cash and cash equivalents IFRS | ¥8.3 billion | Consolidated |
| Remeasurements of defined benefit plans before tax items that will not be reclassified to profit or loss ociifrs | ¥1.4 billion | Consolidated |
| Total of items that will not be reclassified to profit or loss ociifrs | ¥171.1 billion | Consolidated |
| Total of items that may be reclassified to profit or loss ociifrs | ¥0.1 billion | Consolidated |
| Profit loss before tax IFRS | ¥-29.6 billion | Consolidated |
| Profit loss before tax IFRS | ¥-29.6 billion | Consolidated |
| Profit loss before tax IFRS | ¥-29.6 billion | Consolidated |
| Purchase of treasury stock | ¥-1.00 million | Consolidated |
| Comprehensive income attributable to owners of parent IFRS | ¥-4.0 billion | Consolidated |
| Net cash provided by (used in) financing activities (IFRS) | ¥14.1 billion | Consolidated |
| Provision for doubtful accounts IFRS | ¥45.1 billion | Consolidated |
| Finance income and expenses net IFRS | ¥-36.0 billion | Consolidated |
| Finance income IFRS | ¥63.4 billion | Consolidated |
| Finance income IFRS | ¥63.4 billion | Consolidated |
| Finance costs IFRS | ¥99.4 billion | Consolidated |
| Finance costs IFRS | ¥99.4 billion | Consolidated |
| Gain on sale of investments in subsidiaries and associates IFRS | ¥1.0 billion | Consolidated |
| Profit loss attributable to non controlling interests IFRS | ¥54.7 billion | Consolidated |
| Comprehensive income attributable to non controlling interests IFRS | ¥52.0 billion | Consolidated |
| Other | ¥2.3 billion | Parent only |
| Other | ¥0.4 billion | Parent only |
| Other | ¥0 | Parent only |
| Other | ¥0.4 billion | Parent only |
| Other | ¥62.3 billion | Parent only |
| Personnel expenses | ¥102.5 billion | Parent only |
| Interest income | ¥20.0 billion | Parent only |
| Dividend income | ¥36.1 billion | Parent only |
| Operating income | ¥70.0 billion | Parent only |
| Non-operating income | ¥60.5 billion | Parent only |
| Non-operating expenses | ¥104.4 billion | Parent only |
| Gain on sales of non-current assets | ¥71.00 million | Parent only |
| Loss on retirement of non-current assets | ¥0.8 billion | Parent only |
| Rents | ¥15.2 billion | Parent only |
| Cost of sales | ¥266.2 billion | Parent only |
| Gross profit (loss) | ¥701.2 billion | Parent only |
| Net sales | ¥967.4 billion | Parent only |
| Advertising and promotion expenses | ¥93.3 billion | Parent only |
| Net income (loss) | ¥-25.8 billion | Parent only |
| Net income (loss) | ¥-25.8 billion | Parent only |
| Provision for directors' retirement benefits | ¥0.9 billion | Parent only |
| Gain on sales of investment securities | ¥8.00 million | Parent only |
| Interest expenses | ¥76.7 billion | Parent only |
| Commission fees | ¥8.7 billion | Parent only |
| Commission fees | ¥87.4 billion | Parent only |
| Issuance of new shares | ¥13.7 billion | Parent only |
| Provision for shareholder benefit program | ¥8.6 billion | Parent only |
| Income taxes - current | ¥11.4 billion | Parent only |
| Income taxes | ¥-1.2 billion | Parent only |
| Income taxes - deferred | ¥-12.7 billion | Parent only |
| Depreciation | ¥51.3 billion | Parent only |
| Impairment loss | ¥24.7 billion | Parent only |
| Foreign exchange gains | ¥2.1 billion | Parent only |
| Extraordinary income | ¥21.5 billion | Parent only |
| Extraordinary loss | ¥74.6 billion | Parent only |
| Income (loss) before income taxes | ¥-27.0 billion | Parent only |
| Ordinary income | ¥26.1 billion | Parent only |
| Purchase of treasury stock | ¥-1.00 million | Parent only |
| Provision for loss on litigation | ¥7.1 billion | Parent only |
| Selling, general and administrative expenses | ¥631.2 billion | Parent only |
| Selling, general and administrative expenses | ¥631.2 billion | Parent only |
| Provision of allowance for doubtful accounts | ¥0.2 billion | Parent only |
| Provision for bonuses | ¥6.4 billion | Parent only |
| Communication expenses | ¥11.2 billion | Parent only |
| Loss on valuation of shares of subsidiaries and associates | ¥41.3 billion | Parent only |
| Gain on liquidation of subsidiaries and associates | ¥0.2 billion | Parent only |
Statement of cash flows (20 items)
| Item | Value | Consolidated / Non-consolidated |
|---|---|---|
| Other | ¥-37.00 million | Consolidated |
| Other | ¥-14.0 billion | Consolidated |
| Repayments of lease obligations | ¥-69.1 billion | Consolidated |
| Interest paid fin cfifrs | ¥-80.6 billion | Consolidated |
| Increase decrease in trade payables ope cfifrs | ¥27.4 billion | Consolidated |
| Decrease increase in trade receivables ope cfifrs | ¥-16.8 billion | Consolidated |
| Proceeds from withdrawal of time deposits inv cfifrs | ¥12.0 billion | Consolidated |
| Payments into time deposits inv cfifrs | ¥-18.3 billion | Consolidated |
| Proceeds from sale of investments accounted for using equity method inv cfifrs | ¥4.7 billion | Consolidated |
| Purchase of marketable securities inv cfifrs | ¥-11.9 billion | Consolidated |
| Purchase of property plant and equipment inv cfifrs | ¥-65.7 billion | Consolidated |
| Income taxes refund (paid) | ¥-84.7 billion | Consolidated |
| Depreciation and amortization | ¥320.5 billion | Consolidated |
| Impairment losses reversal of impairment losses ope cfifrs | ¥68.3 billion | Consolidated |
| Purchase of intangible assets inv cfifrs | ¥-140.3 billion | Consolidated |
| Decrease/increase in short-term loans payable | ¥-0.6 billion | Consolidated |
| Redemption of bonds fin cfifrs | ¥-476.2 billion | Consolidated |
| Proceeds from issuance of bonds fin cfifrs | ¥158.8 billion | Consolidated |
| Proceeds from long term borrowings fin cfifrs | ¥79.5 billion | Consolidated |
| Repayments of long term borrowings fin cfifrs | ¥-154.0 billion | Consolidated |
Statement of changes in equity (2 items)
| Item | Value | Consolidated / Non-consolidated |
|---|---|---|
| Total changes during the period | ¥-10.0 billion | Parent only |
| Net changes in items other than shareholders' equity | ¥2.0 billion | Parent only |
Basic indicators
| Item | Value | Consolidated / Non-consolidated | Source |
|---|---|---|---|
| Net cash provided by (used in) operating activities | ¥424.1 billion | Consolidated | Disclosed |
| Dividend per share | Not disclosed | Not applicable | Not disclosed |
| Number of employees | 29,419 | Consolidated | Disclosed |
| Net assets | ¥1,354.2 billion | Consolidated | Disclosed |
| Net sales | ¥2,496.6 billion | Consolidated | Disclosed |
| Operating income | ¥14.4 billion | Consolidated | Disclosed |
| Ordinary income | ¥26.1 billion | Parent only | Disclosed |
| Net income | ¥-177.9 billion | Consolidated | Disclosed |
| Total assets | ¥28,804.4 billion | Consolidated | Disclosed |
| Operating margin | 0.6% | Consolidated | Calculated |
| Net margin | -7.1% | Consolidated | Calculated |
| Sales per employee | 84862674 yen | Consolidated | Calculated |
| Total asset turnover | 0.09 times | Consolidated | Calculated |
| Net assets to total assets | 4.7% | Consolidated | Calculated |