ZOJIRUSHI
ZOJIRUSHI CORPORATION
Company highlights
The annual dividend per share has risen for 2 consecutive years.
Key figures
Period 2024-11-21 to 2025-11-20ConsolidatedJapanese GAAP
Company profile
Tables scroll sideways
Disclosed data
Business activities and revenue composition
Revenue and profit by business segment
Disclosed segments (business divisions used in reporting): one
Revenue and profit
ZOJIRUSHI
Period 2024-11-21 to 2025-11-20Source Annual securities reports
Amounts by account
| Group | Account | Amount | Consolidated / Non-consolidated |
|---|---|---|---|
| Selling, general and administrative expenses | Payrolls and allowances | ¥4.9 billion | Consolidated |
| Advertising expenses | ¥2.8 billion | Consolidated | |
| Business consignment expenses | ¥1.6 billion | Parent only | |
| Provision for bonuses | ¥0.9 billion | Consolidated | |
| Depreciation | ¥0.3 billion | Parent only | |
| Provision for product warranties | ¥-0.2 billion | Consolidated | |
| Retirement benefit expenses | ¥0.1 billion | Consolidated | |
| Provision of allowance for doubtful accounts | ¥23.00 million | Consolidated | |
| Profit by stage | Gross profit (loss) | ¥30.4 billion | Consolidated |
| Ordinary income | ¥8.3 billion | Consolidated | |
| Operating income | ¥7.4 billion | Consolidated | |
| Net income | ¥6.0 billion | Consolidated |
ZOJIRUSHI
Selling, general and administrative expenses
Period 2024-11-21 to 2025-11-20Source Annual securities reports
- Payrolls and allowances ¥4.9 billion
- Advertising expenses ¥2.8 billion
- Business consignment expenses ¥1.6 billion
- Provision for bonuses ¥0.9 billion
- Depreciation ¥0.3 billion
- Other (not itemized) ¥12.6 billion
Performance, financial position and capital allocation
Long-term changes in performance
ZOJIRUSHI
Long-term revenue, profit and asset trends
Period 2012 to 2025Source Annual securities reportsDisclosed
ZOJIRUSHI
Recent performance trends
Source Annual securities reports
Year-on-year comparison
| Item | 2021 | 2022 | 2023 | 2024 | 2025 |
|---|---|---|---|---|---|
| Net sales | ¥77.7B | ¥82.5B | ¥83.5B | ¥87.2B | ¥91.2B |
| Year on year (%) | +3.6% | +6.3% | +1.2% | +4.5% | +4.5% |
| Ordinary income (loss) | ¥6.8B | ¥5.8B | ¥6.5B | ¥7.4B | ¥8.3B |
| Change from prior year | +18.6% | -14.4% | +11.7% | +14.0% | +12.1% |
| Ordinary income (loss) as a share of Net sales | 8.7% | 7.0% | 7.8% | 8.5% | 9.1% |
| Change (percentage points) | +1.1 points | -1.7 points | +0.7 points | +0.7 points | +0.6 points |
Fiscal periods marked for changes
Earlier fiscal periods (1)
- 2014Ordinary income (loss) as a share of revenue +5.2 points
- 2015Ordinary income (loss) as a share of revenue +3.2 points
- 2017Ordinary income (loss) as a share of revenue -3.3 points
- 2018Ordinary income (loss) as a share of revenue -2.1 points
ZOJIRUSHI
Earnings and net assets per share over time
Unit yenSource Annual securities reports
ZOJIRUSHI
Return on equity over time
Unit %Source Annual securities reports
Consolidated indicators (14 items)
| Item | 4 years ago | 3 years ago | 2 years ago | Last year | This year |
|---|---|---|---|---|---|
| Net sales | ¥77.7 billion | ¥82.5 billion | ¥83.5 billion | ¥87.2 billion | ¥91.2 billion |
| Ordinary income (loss) | ¥6.8 billion | ¥5.8 billion | ¥6.5 billion | ¥7.4 billion | ¥8.3 billion |
| Net income (loss) attributable to owners of parent | ¥4.5 billion | ¥3.7 billion | ¥4.4 billion | ¥6.5 billion | ¥6.0 billion |
| Comprehensive income | ¥5.8 billion | ¥6.9 billion | ¥6.4 billion | ¥7.6 billion | ¥9.2 billion |
| Net assets | ¥76.8 billion | ¥81.3 billion | ¥85.3 billion | ¥87.3 billion | ¥89.6 billion |
| Total assets | ¥101.9 billion | ¥111.2 billion | ¥112.4 billion | ¥114.8 billion | ¥118.3 billion |
| Net assets per share | 1,127.06 yen | 1,189.27 yen | 1,248.41 yen | 1,318.11 yen | 1,397.16 yen |
| Basic earnings (loss) per share | 66.69 yen | 54.09 yen | 65.64 yen | 96.63 yen | 92.3 yen |
| Equity-to-asset ratio | 74.8% | 72.4% | 75.1% | 75.3% | 75.0% |
| Return on equity | 6.1% | 4.7% | 5.4% | 7.6% | 6.8% |
| Net cash provided by (used in) operating activities | ¥5.2 billion | ¥-0.3 billion | ¥4.9 billion | ¥5.5 billion | ¥9.9 billion |
| Net cash provided by (used in) investing activities | ¥-0.8 billion | ¥-2.6 billion | ¥-2.1 billion | ¥-31.00 million | ¥-2.1 billion |
| Net cash provided by (used in) financing activities | ¥-2.4 billion | ¥-2.9 billion | ¥-3.0 billion | ¥-6.4 billion | ¥-9.1 billion |
| Cash and cash equivalents | ¥35.2 billion | ¥31.1 billion | ¥31.2 billion | ¥30.6 billion | ¥29.6 billion |
Parent only indicators (14 items)
| Item | 4 years ago | 3 years ago | 2 years ago | Last year | This year |
|---|---|---|---|---|---|
| Net sales | ¥66.8 billion | ¥71.1 billion | ¥67.5 billion | ¥72.8 billion | ¥75.9 billion |
| Ordinary income (loss) | ¥5.6 billion | ¥5.9 billion | ¥3.8 billion | ¥5.6 billion | ¥6.0 billion |
| Net income (loss) | ¥4.0 billion | ¥4.2 billion | ¥2.9 billion | ¥5.4 billion | ¥4.4 billion |
| Capital stock | ¥4.0 billion | ¥4.0 billion | ¥4.0 billion | ¥4.0 billion | ¥4.0 billion |
| Total number of issued shares (common stock) | 72,600,000 shares | 72,600,000 shares | 72,600,000 shares | 72,600,000 shares | 72,600,000 shares |
| Net assets | ¥62.9 billion | ¥64.7 billion | ¥65.8 billion | ¥66.5 billion | ¥65.7 billion |
| Total assets | ¥80.4 billion | ¥83.0 billion | ¥82.5 billion | ¥85.3 billion | ¥84.3 billion |
| Net assets per share | 930.3 yen | 955.82 yen | 972.99 yen | 1,014.42 yen | 1,034.31 yen |
| Dividend per share | 34 yen | 34 yen | 34 yen | 40 yen | 82 yen |
| Interim dividend per share | 15 yen | 17 yen | 17 yen | 17 yen | 30 yen |
| Basic earnings (loss) per share | 59.62 yen | 62.25 yen | 42.65 yen | 80.51 yen | 68.67 yen |
| Equity-to-asset ratio | 78.3% | 77.9% | 79.8% | 78.0% | 77.9% |
| Return on equity | 6.5% | 6.6% | 4.4% | 8.1% | 6.7% |
| Payout ratio | 57.0% | 54.6% | 79.7% | 49.7% | 119.4% |
Dividend history
| Fiscal year | Annual dividend per share | Of which interim | Payout ratio (as reported, parent only) | Flag |
|---|---|---|---|---|
| FY ending 11/2025 | ¥82 | ¥30 | 119.4% | |
| FY ending 11/2024 | ¥40 | ¥17 | 49.7% | |
| FY ending 11/2023 | ¥34 | ¥17 | 79.7% | |
| FY ending 11/2022 | ¥34 | ¥17 | 54.6% | |
| FY ending 11/2021 | ¥34 | ¥15 | 57.0% | |
| FY ending 11/2020 | ¥26 | ¥13 | 59.5% | |
| FY ending 11/2019 | ¥26 | ¥13 | 54.6% | |
| FY ending 11/2018 | ¥30 | ¥15 | 48.2% | |
| FY ending 11/2017 | ¥22 | ¥11 | 24.0% | |
| FY ending 11/2016 | ¥22 | ¥10 | 25.0% | |
| FY ending 11/2015 | ¥20 | ¥8 | 24.2% | |
| FY ending 11/2014 | ¥10 | ¥4 | 26.4% | |
| FY ending 11/2013 | ¥8 | ¥4 | 33.4% | |
| FY ending 11/2012 | ¥8 | ¥3.5 | 17.0% |
ZOJIRUSHI
Dividends per share over time
Unit yenSource Annual securities reports
Shareholder composition
Share ownership by holder category
ZOJIRUSHI
Unit %Source Annual securities reports
- Financial institutions10.40%
- Securities firms0.10%
- Other corporations18.70%
- Foreign holders (institutions)19.70%
- Foreign holders (individuals)0.00%
- Individuals and others51.10%
Major shareholders
| Rank | Shareholder | Shareholding ratio | Shares held |
|---|---|---|---|
| 1 | CLEARSTREAM BANKING S.A(常任代理人 香港上海銀行東京支店) | 16.01% | 10,166,000 |
| 2 | 市 川 典 男 | 8.5% | 5,399,000 |
| 3 | 日本マスタートラスト信託銀行株式会社(信託口) | 7.18% | 4,562,000 |
| 4 | 和幸株式会社 | 6.6% | 4,196,000 |
| 5 | 市 川 昌 宏 | 4.83% | 3,071,000 |
| 6 | 象印共栄持株会 | 3.94% | 2,503,000 |
| 7 | 市 川 泰 宏 | 3.26% | 2,071,000 |
| 8 | 公益財団法人市川国際奨学財団 | 2.59% | 1,650,000 |
| 9 | 三菱UFJ信託銀行株式会社(常任代理人 日本マスタートラスト信託銀行株式会社) | 2.44% | 1,552,000 |
| 10 | 市 川 尚 孝 | 1.87% | 1,189,000 |
Research and development expenses and capital expenditure
| Fiscal year | Research and development | Capital expenditure |
|---|---|---|
| FY ending 11/2025 | ¥1.0 billion | ¥1.9 billion |
| FY ending 11/2024 | ¥1.0 billion | Could not be retrieved |
| FY ending 11/2020 | ¥0.8 billion | ¥1.4 billion |
| FY ending 11/2019 | ¥0.8 billion | Could not be retrieved |
| FY ending 11/2016 | ¥0.6 billion | Could not be retrieved |
| FY ending 11/2015 | ¥0.5 billion | Could not be retrieved |
Revenue scale in the same industry
ZOJIRUSHI
Source Annual securities reports of each company
Electric Appliances: 239 companies · revenue · largest first・each company’s latest fiscal year・Consolidated・Disclosed
- 1 SONY GROUPFY Mar 2026 ¥12.5T
- 2 HitachiFY Mar 2026 ¥10.6T
- 3 PanasonicFY Mar 2026 ¥8.0T
- … 88 companies
- 92 DIAMOND ELECTRICFY Mar 2026 ¥96.8B
- 93 Kyosan Electric ManufacturingFY Mar 2026 ¥93.1B
- 94 ZOJIRUSHIThis companyFY Nov 2025 ¥91.2B
- 95 YOKOWOFY Mar 2026 ¥90.1B
- 96 SHIBAURA MECHATRONICSFY Mar 2026 ¥88.0B
- … 143 companies
Workforce information
Administrative filings and published information
Workplace information filings
| Item | Value |
|---|---|
| Employees | 1,314 |
| Annual paid leave taken |
79% |
| Share of managers who are women | 5.9% |
Audit and disclosure information
| Item | Value |
|---|---|
| Audit firm | 有限責任あずさ監査法人 |
| Audit fees (this year, total) | ¥45.00 million |
| Non-audit fees (this year, total) | Not applicable |
| Audit fees (this year, network firms) | ¥8.00 million |
| Non-audit fees (this year, network firms) | ¥5.00 million |
| Going concern note | Cannot be determined |
| Accounting standard | Japanese GAAP |
Related books, articles and videos
Books that cover companies in the same industry
This company: not covered in this book
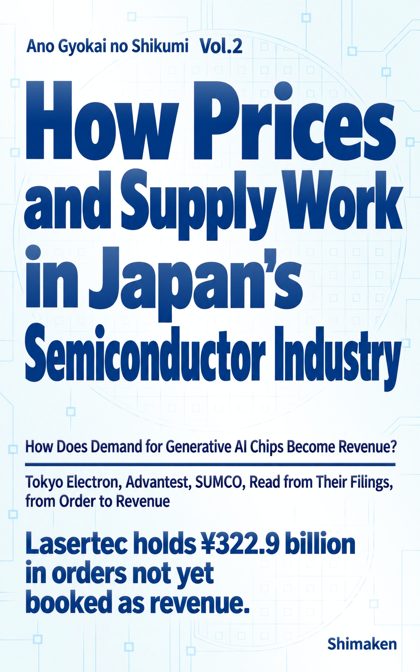 Same industry: Electric Appliances
“How Prices and Supply Work in Japan's Semiconductor Industry”
Reads the filings of makers of chips and of chip-making and testing equipment for the time lag from order to sales and cash, and for how prices and supply are set.
Electric Appliances companies in this book: Tokyo Electron, ADVANTEST, Lasertec and others (5 in all)
“Ano Gyokai no Shikumi” series, Vol.2 — Kindle and paperback
Find it on Amazon →
Sources and methodology
Retrieved disclosed figures
Major management indicators (5 years) (28 items)
| Item | Value | Consolidated / Non-consolidated |
|---|---|---|
| Comprehensive income | ¥9.2 billion | Consolidated |
| Net cash provided by (used in) operating activities | ¥9.9 billion | Consolidated |
| Net sales | ¥91.2 billion | Consolidated |
| Net cash provided by (used in) investing activities | ¥-2.1 billion | Consolidated |
| Cash and cash equivalents | ¥29.6 billion | Consolidated |
| Net assets | ¥89.6 billion | Consolidated |
| Ordinary income (loss) | ¥8.3 billion | Consolidated |
| Total assets | ¥118.3 billion | Consolidated |
| Return on equity | 6.8% | Consolidated |
| Equity-to-asset ratio | 75.0% | Consolidated |
| Net income (loss) attributable to owners of parent | ¥6.0 billion | Consolidated |
| Net cash provided by (used in) financing activities | ¥-9.1 billion | Consolidated |
| Basic earnings (loss) per share | 92.3 yen | Consolidated |
| Net assets per share | 1,397.16 yen | Consolidated |
| Dividend per share | 82 yen | Parent only |
| Net sales | ¥75.9 billion | Parent only |
| Net income (loss) | ¥4.4 billion | Parent only |
| Total number of issued shares (common stock) | 72,600,000 shares | Parent only |
| Net assets | ¥65.7 billion | Parent only |
| Ordinary income (loss) | ¥6.0 billion | Parent only |
| Total assets | ¥84.3 billion | Parent only |
| Return on equity | 6.7% | Parent only |
| Equity-to-asset ratio | 77.9% | Parent only |
| Capital stock | ¥4.0 billion | Parent only |
| Payout ratio | 119.4% | Parent only |
| Interim dividend per share | 30 yen | Parent only |
| Basic earnings (loss) per share | 68.67 yen | Parent only |
| Net assets per share | 1,034.31 yen | Parent only |
Employees (11 items)
| Item | Value | Consolidated / Non-consolidated |
|---|---|---|
| Number of employees | 1,515 people | Consolidated |
| Number of employees | 1,515 people | Consolidated |
| Wage gap between men and women (all employees) | 67.3% | Parent only |
| Average length of service (years) | 14.2 years | Parent only |
| Average annual salary | ¥8.35 million | Parent only |
| Average age (years) | 39.8 years old | Parent only |
| Number of employees | 527 people | Parent only |
| Number of employees | 527 people | Parent only |
| Number of employees | 527 people | Parent only |
| Wage gap between men and women (regular employees) | 73.9% | Parent only |
| Wage gap between men and women (non-regular employees) | 75.3% | Parent only |
Other disclosed items (11 items)
| Item | Value | Consolidated / Non-consolidated |
|---|---|---|
| Average number of temporary employees | 1,230 people | Consolidated |
| Average number of temporary employees | 1,230 people | Consolidated |
| Number of associates accounted for using equity method | 1 companies | Consolidated |
| Write-downs of inventories | ¥-23.00 million | Consolidated |
| Number of consolidated subsidiaries | 11 companies | Consolidated |
| Rate of male employees taking childcare leave (all employees) | 104.5% | Parent only |
| Average number of temporary employees | 133 people | Parent only |
| Average number of temporary employees | 133 people | Parent only |
| Average number of temporary employees | 133 people | Parent only |
| Total return on the share price index | 215.5% | Parent only |
| Ratio of female employees in managerial positions | 5.9% | Parent only |
Shares (15 items)
| Item | Value | Consolidated / Non-consolidated |
|---|---|---|
| Number of shares held in others names treasury shares etc | 285,000 shares | Consolidated |
| Number of shares held | 36,359,000 shares | Consolidated |
| Total number of shares held treasury shares etc | 9,389,600 shares | Consolidated |
| Number of issues whose number of shares increased shares other than those not listed investment shares held for purposes other than pure investment reporting company | 10 issues | Consolidated |
| Total acquisition cost for increased shares shares other than those not listed investment shares held for purposes other than pure investment reporting company | ¥33.00 million | Consolidated |
| Number of shares | 72,600,000 shares | Consolidated |
| Shareholding ratio treasury shares etc | 12.9% | Consolidated |
| Shareholding ratio | 57.2% | Consolidated |
| Number of shares held in own name treasury shares etc | 9,104,600 shares | Consolidated |
| Number of voting rights | 631,812 units | Consolidated |
| Carrying amount on the balance sheet | ¥0.3 billion | Consolidated |
| Carrying amount on the balance sheet | ¥8.3 billion | Consolidated |
| Number of issues | 6 issues | Consolidated |
| Number of issues | 30 issues | Consolidated |
| Total shareholder return | 93.9% | Parent only |
Research and development (3 items)
| Item | Value | Consolidated / Non-consolidated |
|---|---|---|
| Research and development expenses included in general and administrative expenses and manufacturing cost for current period | ¥1.0 billion | Consolidated |
| Research and development expenses | ¥1.0 billion | Consolidated |
| Research and development expenses | ¥1.0 billion | Consolidated |
Property and facilities (1 items)
| Item | Value | Consolidated / Non-consolidated |
|---|---|---|
| Capital expenditures | ¥1.9 billion | Consolidated |
Audit (7 items)
| Item | Value | Consolidated / Non-consolidated |
|---|---|---|
| Fees for audit and attestation services - reporting company | ¥45.00 million | Consolidated |
| Fees for audit and attestation services - total | ¥8.00 million | Consolidated |
| Fees for audit and attestation services - total | ¥45.00 million | Consolidated |
| Fees for audit and attestation services - consolidated subsidiaries | ¥8.00 million | Consolidated |
| Fees for non-audit services - reporting company | ¥4.00 million | Consolidated |
| Fees for non-audit services - total | ¥5.00 million | Consolidated |
| Non audit fees consolidated subsidiaries network firms | ¥1.00 million | Consolidated |
Balance sheet (125 items)
| Item | Value | Consolidated / Non-consolidated |
|---|---|---|
| Other | ¥0.2 billion | Consolidated |
| Other | ¥0.8 billion | Consolidated |
| Other | ¥2.2 billion | Consolidated |
| Other | ¥2.8 billion | Consolidated |
| Other | ¥0.1 billion | Consolidated |
| Valuation difference on available-for-sale securities | ¥4.6 billion | Consolidated |
| Software | ¥0.5 billion | Consolidated |
| Lease obligations | ¥0.9 billion | Consolidated |
| Lease obligations | ¥0.6 billion | Consolidated |
| Lease assets | ¥3.2 billion | Consolidated |
| Lease assets, net | ¥1.3 billion | Consolidated |
| Work in process | ¥0.4 billion | Consolidated |
| Retained earnings | ¥76.1 billion | Consolidated |
| Raw materials and supplies | ¥5.8 billion | Consolidated |
| Notes receivable - trade | ¥0.2 billion | Consolidated |
| Merchandise and finished goods | ¥26.1 billion | Consolidated |
| Non-current liabilities | ¥7.2 billion | Consolidated |
| Non-current assets | ¥33.0 billion | Consolidated |
| Land | ¥7.0 billion | Consolidated |
| Accounts receivable - trade | ¥15.6 billion | Consolidated |
| Contract liabilities | ¥0.2 billion | Consolidated |
| Tools, furniture and fixtures | ¥12.2 billion | Consolidated |
| Tools, furniture and fixtures | ¥1.8 billion | Consolidated |
| Buildings and structures | ¥13.5 billion | Consolidated |
| Buildings and structures, net | ¥2.9 billion | Consolidated |
| Construction in progress | ¥0.2 billion | Consolidated |
| Investments and other assets | ¥18.5 billion | Consolidated |
| Investment securities | ¥11.3 billion | Consolidated |
| Notes and accounts payable - trade | ¥8.0 billion | Consolidated |
| Property, plant and equipment | ¥13.8 billion | Consolidated |
| Income taxes payable | ¥1.4 billion | Consolidated |
| Accrued expenses | ¥5.5 billion | Consolidated |
| Shareholders' equity | ¥76.8 billion | Consolidated |
| Machinery, equipment and vehicles | ¥4.3 billion | Consolidated |
| Machinery, equipment and vehicles, net | ¥0.6 billion | Consolidated |
| Current liabilities | ¥21.5 billion | Consolidated |
| Current assets | ¥85.4 billion | Consolidated |
| Accumulated depreciation | ¥-1.9 billion | Consolidated |
| Accumulated depreciation | ¥-10.4 billion | Consolidated |
| Accumulated depreciation | ¥-10.6 billion | Consolidated |
| Accumulated depreciation | ¥-3.8 billion | Consolidated |
| Foreign currency translation adjustment | ¥6.1 billion | Consolidated |
| Intangible assets | ¥0.7 billion | Consolidated |
| Cash and cash equivalents | ¥29.6 billion | Consolidated |
| Cash and deposits | ¥33.2 billion | Consolidated |
| Net assets | ¥89.6 billion | Consolidated |
| Net assets | ¥89.6 billion | Consolidated |
| Total assets | ¥118.3 billion | Consolidated |
| Deferred tax liabilities | ¥3.7 billion | Consolidated |
| Deferred tax assets | ¥0.6 billion | Consolidated |
| Treasury stock | ¥-7.6 billion | Consolidated |
| Provision for product warranties | ¥0.2 billion | Consolidated |
| Valuation and translation adjustments | ¥11.9 billion | Consolidated |
| Liabilities | ¥28.7 billion | Consolidated |
| Liabilities and net assets | ¥118.3 billion | Consolidated |
| Allowance for doubtful accounts | ¥-27.00 million | Consolidated |
| Allowance for doubtful accounts | ¥-21.00 million | Consolidated |
| Capital surplus | ¥4.4 billion | Consolidated |
| Capital stock | ¥4.0 billion | Consolidated |
| Provision for bonuses | ¥1.4 billion | Consolidated |
| Remeasurements of defined benefit plans | ¥1.2 billion | Consolidated |
| Net defined benefit liability | ¥2.4 billion | Consolidated |
| Net defined benefit asset | ¥5.7 billion | Consolidated |
| Electronically recorded monetary claims - operating | ¥1.4 billion | Consolidated |
| Non-controlling interests | ¥0.9 billion | Consolidated |
| Other | ¥71.00 million | Parent only |
| Other | ¥0.5 billion | Parent only |
| Other | ¥70.00 million | Parent only |
| Other | ¥23.00 million | Parent only |
| Other | ¥0.2 billion | Parent only |
| Other | ¥0.1 billion | Parent only |
| Valuation difference on available-for-sale securities | ¥4.6 billion | Parent only |
| Other capital surplus | ¥0.3 billion | Parent only |
| Software | ¥0.4 billion | Parent only |
| General reserve | ¥22.5 billion | Parent only |
| Retained earnings | ¥60.2 billion | Parent only |
| Legal retained earnings | ¥0.5 billion | Parent only |
| Prepaid pension cost | ¥4.4 billion | Parent only |
| Raw materials and supplies | ¥2.2 billion | Parent only |
| Notes receivable - trade | ¥0.2 billion | Parent only |
| Merchandise and finished goods | ¥15.2 billion | Parent only |
| Non-current liabilities | ¥4.5 billion | Parent only |
| Non-current assets | ¥31.6 billion | Parent only |
| Reserve for advanced depreciation of noncurrent assets | ¥89.00 million | Parent only |
| Land | ¥6.4 billion | Parent only |
| Accounts receivable - trade | ¥18.0 billion | Parent only |
| Contract liabilities | ¥35.00 million | Parent only |
| Tools, furniture and fixtures | ¥1.7 billion | Parent only |
| Buildings, net | ¥2.5 billion | Parent only |
| Construction in progress | ¥0.2 billion | Parent only |
| Investments and other assets | ¥20.0 billion | Parent only |
| Investment securities | ¥8.9 billion | Parent only |
| Property, plant and equipment | ¥11.0 billion | Parent only |
| Accounts receivable - other | ¥1.9 billion | Parent only |
| Income taxes payable | ¥1.0 billion | Parent only |
| Accrued consumption taxes | ¥0.2 billion | Parent only |
| Accrued expenses | ¥2.9 billion | Parent only |
| Accounts payable - other | ¥0.4 billion | Parent only |
| Shareholders' equity | ¥61.1 billion | Parent only |
| Current liabilities | ¥14.1 billion | Parent only |
| Current assets | ¥52.7 billion | Parent only |
| Intangible assets | ¥0.6 billion | Parent only |
| Cash and deposits | ¥13.7 billion | Parent only |
| Net assets | ¥65.7 billion | Parent only |
| Net assets | ¥65.7 billion | Parent only |
| Total assets | ¥84.3 billion | Parent only |
| Deferred tax liabilities | ¥1.9 billion | Parent only |
| Retained earnings brought forward | ¥36.9 billion | Parent only |
| Treasury stock | ¥-7.6 billion | Parent only |
| Provision for product warranties | ¥0.3 billion | Parent only |
| Valuation and translation adjustments | ¥4.6 billion | Parent only |
| Liabilities | ¥18.6 billion | Parent only |
| Liabilities and net assets | ¥84.3 billion | Parent only |
| Accounts payable - trade | ¥6.5 billion | Parent only |
| Allowance for doubtful accounts | ¥-2.00 million | Parent only |
| Allowance for doubtful accounts | ¥-0 | Parent only |
| Capital surplus | ¥4.4 billion | Parent only |
| Legal capital surplus | ¥4.1 billion | Parent only |
| Capital stock | ¥4.0 billion | Parent only |
| Provision for bonuses | ¥0.9 billion | Parent only |
| Provision for retirement benefits | ¥2.4 billion | Parent only |
| Reserve for dividends3 | ¥0.2 billion | Parent only |
| Long term guarantee deposited | ¥0.1 billion | Parent only |
| Shares of subsidiaries and associates | ¥6.3 billion | Parent only |
| Electronically recorded monetary claims - operating | ¥1.3 billion | Parent only |
Accounts unique to this company (4 items)
| Item | Value | Consolidated / Non-consolidated |
|---|---|---|
| Revenue | ¥2.0 billion | Consolidated |
| Revenue | ¥9.00 million | Consolidated |
| Revenue | ¥31.00 million | Consolidated |
| Revenue | ¥1.7 billion | Parent only |
Statement of income (91 items)
| Item | Value | Consolidated / Non-consolidated |
|---|---|---|
| Other | ¥0.1 billion | Consolidated |
| Other | ¥88.00 million | Consolidated |
| Other comprehensive income | ¥3.1 billion | Consolidated |
| Valuation difference on available for sale securities net of tax | ¥1.5 billion | Consolidated |
| Purchase discounts | ¥27.00 million | Consolidated |
| Dividends from surplus | ¥-3.5 billion | Consolidated |
| Comprehensive income | ¥9.2 billion | Consolidated |
| Royalty income | ¥41.00 million | Consolidated |
| Interest income | ¥0.3 billion | Consolidated |
| Rent income | ¥0.1 billion | Consolidated |
| Dividend income | ¥0.2 billion | Consolidated |
| Operating income | ¥7.4 billion | Consolidated |
| Non-operating income | ¥1.1 billion | Consolidated |
| Non-operating expenses | ¥0.3 billion | Consolidated |
| Net cash provided by (used in) operating activities | ¥9.9 billion | Consolidated |
| Gain on sales of non-current assets | ¥6.00 million | Consolidated |
| Rent expenses on non-current assets | ¥34.00 million | Consolidated |
| Loss on retirement of non-current assets | ¥15.00 million | Consolidated |
| Cost of sales | ¥60.7 billion | Consolidated |
| Gross profit (loss) | ¥30.4 billion | Consolidated |
| Net sales | ¥91.2 billion | Consolidated |
| Advertising expenses | ¥2.8 billion | Consolidated |
| Net income | ¥6.0 billion | Consolidated |
| Net income | ¥6.0 billion | Consolidated |
| Net income (loss) | ¥6.1 billion | Consolidated |
| Net income (loss) | ¥6.1 billion | Consolidated |
| Net cash provided by (used in) investing activities | ¥-2.1 billion | Consolidated |
| Share of profit of investments accounted for using equity method | ¥0.3 billion | Consolidated |
| Share of other comprehensive income of investments accounted for using equity method | ¥93.00 million | Consolidated |
| Interest expenses | ¥40.00 million | Consolidated |
| Income taxes - current | ¥2.1 billion | Consolidated |
| Income taxes | ¥2.5 billion | Consolidated |
| Income taxes - deferred | ¥0.4 billion | Consolidated |
| Foreign exchange losses | ¥0.1 billion | Consolidated |
| Foreign currency translation adjustment net of tax | ¥0.9 billion | Consolidated |
| Extraordinary income | ¥0.3 billion | Consolidated |
| Extraordinary loss | ¥15.00 million | Consolidated |
| Effect of exchange rate change on cash and cash equivalents | ¥0.3 billion | Consolidated |
| Net increase (decrease) in cash and cash equivalents | ¥-1.0 billion | Consolidated |
| Income (loss) before income taxes | ¥8.6 billion | Consolidated |
| Income (loss) before income taxes | ¥8.6 billion | Consolidated |
| Ordinary income | ¥8.3 billion | Consolidated |
| Payrolls and allowances-SGA | ¥4.9 billion | Consolidated |
| Disposal of treasury stock | ¥43.00 million | Consolidated |
| Purchase of treasury stock | ¥-3.4 billion | Consolidated |
| Provision for product warranties | ¥-0.2 billion | Consolidated |
| Comprehensive income attributable to owners of parent | ¥9.1 billion | Consolidated |
| Gain on bargain purchase | ¥0.3 billion | Consolidated |
| Net cash provided by (used in) financing activities | ¥-9.1 billion | Consolidated |
| Selling, general and administrative expenses | ¥23.0 billion | Consolidated |
| Provision of allowance for doubtful accounts | ¥23.00 million | Consolidated |
| Provision for bonuses | ¥0.9 billion | Consolidated |
| Remeasurements of defined benefit plans net of tax | ¥0.6 billion | Consolidated |
| Retirement benefit expenses | ¥0.1 billion | Consolidated |
| Comprehensive income attributable to non-controlling interests | ¥0.1 billion | Consolidated |
| Net income (loss) attributable to non-controlling interests | ¥0.1 billion | Consolidated |
| Other | ¥0.1 billion | Parent only |
| Other | ¥45.00 million | Parent only |
| Dividends from surplus | ¥-3.5 billion | Parent only |
| Royalty income | ¥0.1 billion | Parent only |
| Interest income | ¥83.00 million | Parent only |
| Rent income | ¥0.2 billion | Parent only |
| Dividend income | ¥1.2 billion | Parent only |
| Operating income | ¥4.5 billion | Parent only |
| Non-operating income | ¥1.7 billion | Parent only |
| Non-operating expenses | ¥0.3 billion | Parent only |
| Rent expenses on non-current assets | ¥0.1 billion | Parent only |
| Loss on retirement of non-current assets | ¥11.00 million | Parent only |
| Cost of sales | ¥57.1 billion | Parent only |
| Gross profit (loss) | ¥18.8 billion | Parent only |
| Net sales | ¥75.9 billion | Parent only |
| Advertising expenses | ¥1.9 billion | Parent only |
| Net income (loss) | ¥4.4 billion | Parent only |
| Net income (loss) | ¥4.4 billion | Parent only |
| Interest expenses | ¥0 | Parent only |
| Business consignment expenses | ¥1.6 billion | Parent only |
| Income taxes - current | ¥1.4 billion | Parent only |
| Income taxes | ¥1.5 billion | Parent only |
| Income taxes - deferred | ¥90.00 million | Parent only |
| Depreciation | ¥0.3 billion | Parent only |
| Foreign exchange losses | ¥93.00 million | Parent only |
| Extraordinary loss | ¥11.00 million | Parent only |
| Income (loss) before income taxes | ¥6.0 billion | Parent only |
| Ordinary income | ¥6.0 billion | Parent only |
| Payrolls and allowances-SGA | ¥2.4 billion | Parent only |
| Disposal of treasury stock | ¥43.00 million | Parent only |
| Purchase of treasury stock | ¥-3.4 billion | Parent only |
| Provision for product warranties | ¥-0.2 billion | Parent only |
| Selling, general and administrative expenses | ¥14.3 billion | Parent only |
| Provision for bonuses | ¥0.6 billion | Parent only |
| Retirement benefit expenses | ¥26.00 million | Parent only |
Statement of changes in equity (4 items)
| Item | Value | Consolidated / Non-consolidated |
|---|---|---|
| Total changes during the period | ¥2.3 billion | Consolidated |
| Net changes in items other than shareholders' equity | ¥3.1 billion | Consolidated |
| Total changes during the period | ¥-0.9 billion | Parent only |
| Net changes in items other than shareholders' equity | ¥1.5 billion | Parent only |
Statement of cash flows (34 items)
| Item | Value | Consolidated / Non-consolidated |
|---|---|---|
| Other | ¥0.5 billion | Consolidated |
| Other | ¥-38.00 million | Consolidated |
| Repayments of lease obligations | ¥-0.6 billion | Consolidated |
| Increase decrease in notes and accounts payable trade | ¥0.5 billion | Consolidated |
| Interest expenses paid | ¥-43.00 million | Consolidated |
| Interest and dividends income received | ¥0.9 billion | Consolidated |
| Interest and dividend income | ¥-0.5 billion | Consolidated |
| Loss (gain) on sales of fixed assets | ¥-6.00 million | Consolidated |
| Loss on retirement of non-current assets | ¥15.00 million | Consolidated |
| Decrease increase in notes and accounts receivable trade | ¥0.6 billion | Consolidated |
| Proceeds from withdrawal of time deposits | ¥3.0 billion | Consolidated |
| Payments into time deposits | ¥-3.3 billion | Consolidated |
| Subtotal | ¥11.9 billion | Consolidated |
| Purchase of investment securities | ¥-33.00 million | Consolidated |
| Equity in earnings losses of affiliates | ¥-0.3 billion | Consolidated |
| Interest expenses | ¥40.00 million | Consolidated |
| Purchase of property plant and equipment | ¥-1.4 billion | Consolidated |
| Proceeds from sales of property plant and equipment | ¥11.00 million | Consolidated |
| Increase/(decrease) in accounts payable - expenses | ¥0.4 billion | Consolidated |
| Decrease (increase) in inventories | ¥0.2 billion | Consolidated |
| Income taxes paid | ¥-2.8 billion | Consolidated |
| Depreciation | ¥2.3 billion | Consolidated |
| Purchase of intangible assets | ¥-0.2 billion | Consolidated |
| Regarding purchase of treasury stock | ¥-3.4 billion | Consolidated |
| Increase (decrease) in provisions for product warranties | ¥-0.2 billion | Consolidated |
| Gain on bargain purchase | ¥-0.3 billion | Consolidated |
| Increase (decrease) in allowance for doubtful accounts | ¥22.00 million | Consolidated |
| Increase (decrease) in provision for bonuses | ¥0.1 billion | Consolidated |
| Increase (decrease) in net defined benefit liability | ¥-4.00 million | Consolidated |
| Inorease (decrease) in asset for retirement benefits | ¥-0.1 billion | Consolidated |
| Payments for acquisition in subsidiaries resulting in change in scope of consolidation | ¥-0.2 billion | Consolidated |
| Dividends | ¥-3.5 billion | Consolidated |
| Repayment of long term loans payable | ¥-1.5 billion | Consolidated |
| Dividends paid to non-controlling interests | ¥-84.00 million | Consolidated |
Basic indicators
| Item | Value | Consolidated / Non-consolidated | Source |
|---|---|---|---|
| Net cash provided by (used in) operating activities | ¥9.9 billion | Consolidated | Disclosed |
| Dividend per share | 82 | Parent only | Disclosed |
| Number of employees | 1,515 | Consolidated | Disclosed |
| Net assets | ¥89.6 billion | Consolidated | Disclosed |
| Net sales | ¥91.2 billion | Consolidated | Disclosed |
| Operating income | ¥7.4 billion | Consolidated | Disclosed |
| Ordinary income | ¥8.3 billion | Consolidated | Disclosed |
| Net income | ¥6.0 billion | Consolidated | Disclosed |
| Total assets | ¥118.3 billion | Consolidated | Disclosed |
| Operating margin | 8.2% | Consolidated | Calculated |
| Net margin | 6.6% | Consolidated | Calculated |
| Sales per employee | 60165677 yen | Consolidated | Calculated |
| Total asset turnover | 0.77 times | Consolidated | Calculated |
| Net assets to total assets | 75.7% | Consolidated | Calculated |