Seven & i
Seven & i Holdings Co., Ltd.
Company highlights
Of 20,000 shops in Japan, only 158 are its own.
Vol.3, Chapter 1 (as of 2026-08-19)
Key figures
Period Mar 2025 to Feb 2026ConsolidatedJapanese GAAP
Business revenue model
Featured in
Vol.3, Chapter 1 (as of 2026-08-19)
“Kaisha no Shikumi: Franchising”, Chapter 1: 7-Eleven and Sukiya: The Same Kind of Chain, Opposite Ways of Growing
Book’s reference date 2026-08-19 / data last checked 2026-10-20
Key points in this volumeA chain's profits depend on how the money is divided, not just on how many stores it has.
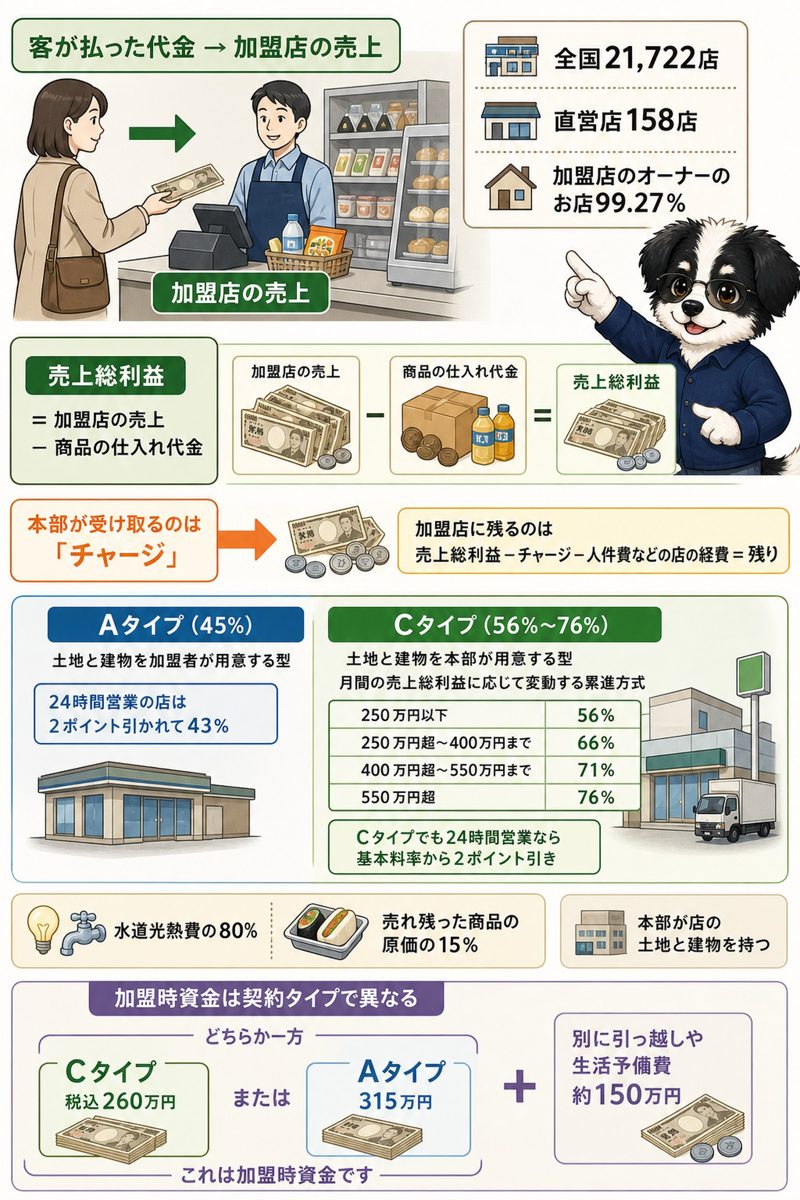
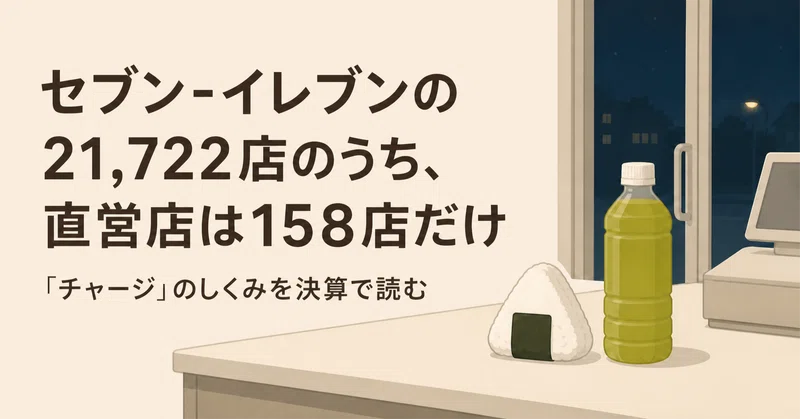
Of the 21,722 Seven-Eleven shops Seven & i Holdings has in Japan, 158 are run by the company itself (as of the end of February 2026; shops of the Okinawa operating company are not included).
What a customer pays first becomes the franchisee's sales. What head office receives is a royalty taken from the franchisee's gross margin, at a rate between 43% and 76%.
The Move That Changed Seven & i
It moved the company overseeing its supermarket business out of consolidation and made it an equity-method affiliate.
For the year ended February 2024, Seven & i Holdings had operating revenue of ¥11.4718 trillion ($71.7 billion) and operating profit of ¥534.2 billion. Alongside the convenience stores it held a superstore business that included Ito-Yokado. In October 2024 the company decided to set up York Holdings to oversee that supermarket business. On March 6, 2025 it signed a definitive agreement with a Bain Capital vehicle, and the transfer value of the business was expected to be ¥814.7 billion. On September 1, 2025, York Holdings left the group of Seven & i subsidiaries and became an equity-method affiliate, whose sales are no longer added to the consolidated figures and only part of whose profit is taken in. The move covered 22 consolidated subsidiaries and 7 equity-method affiliates. Consolidated operating revenue for the year ended February 2026 was ¥10.4303 trillion. Against the 24.33% operating margin of the convenience stores in Japan, the consolidated margin is 4.1%.
Coverage in the book
- The Money for a Rice Ball and the Money for a Beef Bowl Go to Different Companies
- What Does 7-Eleven Earn From?
- 93% of the Head Office's Revenue Comes from Franchisees
- A Margin of 24.33% in Japan and 4.1% on a Consolidated Basis
- York Holdings Became an Equity-Method Affiliate
Related books, articles and videos
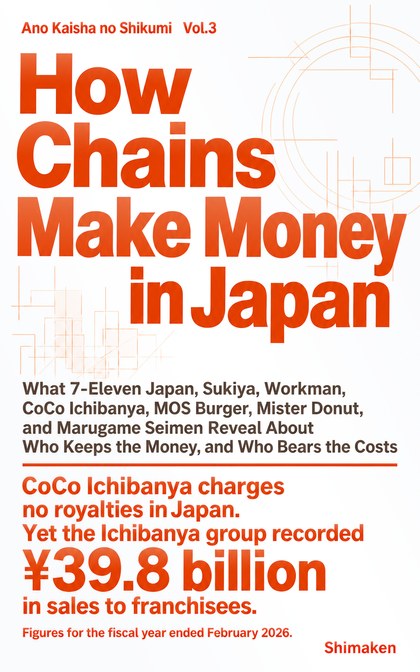 “Kaisha no Shikumi: Franchising”
Chapter 1: Seven & i
“7-Eleven and Sukiya: The Same Kind of Chain, Opposite Ways of Growing”
“Ano Kaisha no Shikumi” series, Vol.3 — Kindle and paperback
Find it on Amazon →

Company profile
Tables scroll sideways
Disclosed data
Business activities and revenue composition
Seven & i
Revenue and profit by business segment
Period Mar 2025 to Feb 2026Source Annual securities reportsConsolidated・Disclosed
| Business | Net sales to external customers | Operating income | |||||
|---|---|---|---|---|---|---|---|
| This year | Share | Last year | This year | Share | Margin | Last year | |
| 海外コンビニエンスストア事業 | ¥8,556.2 billion | 83.2% | ¥9,168.4 billion | ¥222.2 billion | 46.0% | 2.6% | ¥216.2 billion |
| Domestic convenience store | ¥912.2 billion | 8.9% | ¥902.2 billion | ¥222.5 billion | 46.0% | 24.4% | ¥233.6 billion |
| スーパーストア事業 | ¥687.6 billion | 6.7% | ¥1,428.5 billion | ¥17.5 billion | 3.6% | 2.5% | ¥10.4 billion |
| Financial related business | ¥121.8 billion | 1.2% | ¥185.6 billion | ¥21.0 billion | 4.3% | 17.2% | ¥32.0 billion |
| Total of the businesses | ¥10,277.8 billion | 100.0% | ¥483.2 billion | 100.0% | |||
Seven & i
Revenue breakdown
Period Mar 2025 to Feb 2026Source Annual securities reports
- Net sales ¥8,893.7 billion
- Operating receipts ¥1,536.6 billion
- Other revenue form operatione ¥0.7 billion
Revenue and profit
Seven & i
Period Mar 2025 to Feb 2026Source Annual securities reports
Amounts by account
| Group | Account | Amount | Consolidated / Non-consolidated |
|---|---|---|---|
| Revenue breakdown | Net sales | ¥8,893.7 billion | Consolidated |
| Operating receipts | ¥1,536.6 billion | Consolidated | |
| Other revenue form operatione | ¥0.7 billion | Parent only | |
| Selling, general and administrative expenses | Other | ¥770.7 billion | Consolidated |
| Rents | ¥452.0 billion | Consolidated | |
| Depreciation | ¥370.9 billion | Consolidated | |
| Utilities expenses | ¥172.6 billion | Consolidated | |
| Amortization of goodwill | ¥137.9 billion | Consolidated | |
| General and administrative expenses | ¥70.5 billion | Parent only | |
| Legal and employee benefits expenses | ¥65.7 billion | Consolidated | |
| Provision for bonuses | ¥15.0 billion | Consolidated | |
| Commission fees | ¥11.4 billion | Parent only | |
| Retirement benefit expenses | ¥10.9 billion | Consolidated | |
| Profit by stage | Gross profit (loss) | ¥1,593.5 billion | Consolidated |
| Operating income | ¥423.0 billion | Consolidated | |
| Ordinary income | ¥377.4 billion | Consolidated | |
| Net income | ¥292.8 billion | Consolidated |
Seven & i
Selling, general and administrative expenses
Period Mar 2025 to Feb 2026Source Annual securities reports
- Other ¥770.7 billion
- Rents ¥452.0 billion
- Depreciation ¥370.9 billion
- Utilities expenses ¥172.6 billion
- Amortization of goodwill ¥137.9 billion
- General and administrative expenses ¥70.5 billion
- Other (not itemized) ¥732.4 billion
Performance, financial position and capital allocation
Long-term changes in performance
Seven & i
Long-term revenue, profit and asset trends
Period 2013 to 2026Source Annual securities reportsDisclosed
Seven & i
Recent performance trends
Source Annual securities reports
Year-on-year comparison
| Item | 2022 | 2023 | 2024 | 2025 | 2026 |
|---|---|---|---|---|---|
| Operating revenue | ¥8,749.8B | ¥11,811.3B | ¥11,471.8B | ¥11,972.8B | ¥10,430.3B |
| Year on year (%) | Could not be retrieved | +35.0%◆ | -2.9% | +4.4% | -12.9% |
| Ordinary income (loss) | ¥358.6B | ¥475.9B | ¥507.1B | ¥374.6B | ¥377.4B |
| Change from prior year | Could not be retrieved | +32.7% | +6.6% | -26.1% | +0.8% |
| Ordinary income (loss) as a share of Operating revenue | 4.1% | 4.0% | 4.4% | 3.1% | 3.6% |
| Change (percentage points) | Could not be retrieved | -0.1 points | +0.4 points | -1.3 points | +0.5 points |
Fiscal periods marked for changes
- 2023Operating revenue year on year +35.0%
Seven & i
Earnings and net assets per share over time
Unit yenSource Annual securities reports
Seven & i
Return on equity over time
Unit %Source Annual securities reports
Consolidated indicators (15 items)
| Item | 4 years ago | 3 years ago | 2 years ago | Last year | This year |
|---|---|---|---|---|---|
| Operating revenue | ¥8,749.8 billion | ¥11,811.3 billion | ¥11,471.8 billion | ¥11,972.8 billion | ¥10,430.3 billion |
| Ordinary income (loss) | ¥358.6 billion | ¥475.9 billion | ¥507.1 billion | ¥374.6 billion | ¥377.4 billion |
| Net income (loss) attributable to owners of parent | ¥210.8 billion | ¥281.0 billion | ¥224.6 billion | ¥173.1 billion | ¥292.8 billion |
| Comprehensive income | ¥415.9 billion | ¥572.9 billion | ¥424.3 billion | ¥486.4 billion | ¥296.3 billion |
| Net assets | ¥3,147.7 billion | ¥3,648.2 billion | ¥3,900.6 billion | ¥4,223.2 billion | ¥3,648.2 billion |
| Total assets | ¥8,739.3 billion | ¥10,551.0 billion | ¥10,592.1 billion | ¥11,386.1 billion | ¥9,143.0 billion |
| Net assets per share | 1,125.17 yen | 1,311.31 yen | 1,416.94 yen | 1,555.39 yen | 1,566.06 yen |
| Basic earnings (loss) per share | 79.56 yen | 106.05 yen | 84.88 yen | 66.62 yen | 118.81 yen |
| Diluted earnings per share | 79.56 yen | 106.04 yen | 84.87 yen | 66.61 yen | 118.8 yen |
| Equity-to-asset ratio | 34.1% | 32.9% | 35.1% | 35.4% | 39.6% |
| Return on equity | 7.5% | 8.7% | 6.2% | 4.5% | 7.6% |
| Net cash provided by (used in) operating activities | ¥736.5 billion | ¥928.5 billion | ¥673.0 billion | ¥876.5 billion | ¥666.7 billion |
| Net cash provided by (used in) investing activities | ¥-2,505.6 billion | ¥-413.2 billion | ¥-431.8 billion | ¥-732.4 billion | ¥-477.3 billion |
| Net cash provided by (used in) financing activities | ¥937.1 billion | ¥-270.4 billion | ¥-377.1 billion | ¥-392.6 billion | ¥-1,109.9 billion |
| Cash and cash equivalents | ¥1,414.9 billion | ¥1,674.8 billion | ¥1,562.5 billion | ¥1,349.8 billion | ¥426.1 billion |
Parent only indicators (15 items)
| Item | 4 years ago | 3 years ago | 2 years ago | Last year | This year |
|---|---|---|---|---|---|
| Operating revenue | ¥152.2 billion | ¥248.5 billion | ¥202.3 billion | ¥209.7 billion | ¥189.0 billion |
| Ordinary income (loss) | ¥100.7 billion | ¥173.7 billion | ¥122.0 billion | ¥121.7 billion | ¥110.5 billion |
| Net income (loss) | ¥107.1 billion | ¥179.8 billion | ¥42.9 billion | ¥109.6 billion | ¥119.4 billion |
| Capital stock | ¥50.0 billion | ¥50.0 billion | ¥50.0 billion | ¥50.0 billion | ¥50.0 billion |
| Total number of issued shares (common stock) | 886,441,000 shares | 886,441,000 shares | 877,742,000 shares | 2,604,555,000 shares | 2,604,555,000 shares |
| Net assets | ¥1,421.1 billion | ¥1,511.6 billion | ¥1,399.7 billion | ¥1,349.7 billion | ¥762.1 billion |
| Total assets | ¥2,561.1 billion | ¥2,593.9 billion | ¥2,657.3 billion | ¥2,690.4 billion | ¥1,941.7 billion |
| Net assets per share | 536.37 yen | 570.44 yen | 533.61 yen | 520.11 yen | 329.55 yen |
| Dividend per share | 100 yen | 113 yen | 113 yen | 40 yen | 50 yen |
| Interim dividend per share | 48 yen | 49.5 yen | 56.5 yen | 20 yen | 25 yen |
| Basic earnings (loss) per share | 40.43 yen | 67.85 yen | 16.22 yen | 42.17 yen | 48.44 yen |
| Diluted earnings per share | 40.43 yen | 67.85 yen | 16.22 yen | 42.17 yen | 48.43 yen |
| Equity-to-asset ratio | 55.5% | 58.3% | 52.7% | 50.2% | 39.2% |
| Return on equity | 7.6% | 12.3% | 2.9% | 8.0% | 11.3% |
| Payout ratio | 82.4% | 55.5% | 232.2% | 94.9% | 103.2% |
Dividend history
| Fiscal year | Annual dividend per share | Of which interim | Payout ratio (as reported, parent only) | Flag |
|---|---|---|---|---|
| FY ending 2/2026 | ¥50 | ¥25 | 103.2% | |
| FY ending 2/2025 | ¥40 | ¥20 | 94.9% | Stock split or share consolidation noted |
| FY ending 2/2024 | ¥113 | ¥56.5 | 232.2% | |
| FY ending 2/2023 | ¥113 | ¥49.5 | 55.5% | |
| FY ending 2/2022 | ¥100 | ¥48 | 82.4% |
Seven & i
Dividends per share over time
Unit yenSource Annual securities reports
Shareholder composition
Share ownership by holder category
Seven & i
Unit %Source Annual securities reports
- Financial institutions31.02%
- Securities firms4.68%
- Other corporations16.06%
- Foreign holders (institutions)27.34%
- Foreign holders (individuals)0.01%
- Individuals and others20.89%
Major shareholders
| Rank | Shareholder | Shareholding ratio | Shares held |
|---|---|---|---|
| 1 | 日本マスタートラスト信託銀行株式会社(信託口) | 17.08% | 395,433,000 |
| 2 | 伊藤興業株式会社 | 9.16% | 212,103,000 |
| 3 | 株式会社日本カストディ銀行(信託口) | 6.15% | 142,434,000 |
| 4 | 日本生命保険相互会社(常任代理人 日本マスタートラスト信託銀行株式会社) | 2.29% | 53,017,000 |
| 5 | 三井物産株式会社(常任代理人 株式会社日本カストディ銀行) | 2.1% | 48,667,000 |
| 6 | JP MORGAN CHASE BANK 385864(常任代理人 株式会社みずほ銀行) | 2.07% | 47,916,000 |
| 7 | STATE STREET BANK AND TRUST COMPANY 505001(常任代理人 株式会社みずほ銀行) | 2.02% | 46,922,000 |
| 8 | SMBC日興証券株式会社 | 1.65% | 38,247,000 |
| 9 | 三菱UFJモルガン・スタンレー証券株式会社 | 1.46% | 33,864,000 |
| 10 | THE CHASE MANHATTAN BANK,N.A. LONDONSECS LENDING OMNIBUS ACCOUNT(常任代理人 株式会社みずほ銀行) | 1.43% | 33,200,000 |
Research and development expenses and capital expenditure
Research and development expenses and capital expenditure by segment (FY ending 2/2026)
| Segment | Capital expenditure |
|---|---|
| 海外コンビニエンスストア事業 | ¥226.3 billion |
| Domestic convenience store | ¥114.5 billion |
| スーパーストア事業 | ¥17.1 billion |
| Financial related business | ¥35.6 billion |
Revenue scale in the same industry
Seven & i
Source Annual securities reports of each company
Retail Trade: 343 companies · revenue · largest first・each company’s latest fiscal year・Consolidated・Disclosed
- 1 AEONFY Feb 2026 ¥10.7T
- 2 Seven & iThis companyFY Feb 2026 ¥10.4T
- 3 FAST RETAILINGFY Aug 2025 ¥3.4T
- 4 Pan Pacific InternationalFY Jun 2025 ¥2.2T
- … 339 companies
Workforce information
Women 249 Employees by gender
Administrative filings and published information
Workplace information filings
| Item | Value |
|---|---|
| Employees | 865 |
| Average monthly overtime (statutory overtime plus work on statutory days off) |
16.7 hours |
| Annual paid leave taken |
80.2% |
| Childcare leave taken, men |
100% |
| Childcare leave taken, women |
100% |
| Share of managers who are women | 19.7% |
| Share of board members who are women | 21.9% |
Audit and disclosure information
| Item | Value |
|---|---|
| Audit firm | 有限責任あずさ監査法人 |
| Audit fees (this year, total) | ¥0.7 billion |
| Non-audit fees (this year, total) | ¥37.00 million |
| Audit fees (this year, network firms) | ¥0.7 billion |
| Non-audit fees (this year, network firms) | ¥0.2 billion |
| Going concern note | Cannot be determined |
| Accounting standard | Japanese GAAP |
Sources and methodology
Retrieved disclosed figures
Major management indicators (5 years) (30 items)
| Item | Value | Consolidated / Non-consolidated |
|---|---|---|
| Comprehensive income | ¥296.3 billion | Consolidated |
| Operating revenue | ¥10,430.3 billion | Consolidated |
| Net cash provided by (used in) operating activities | ¥666.7 billion | Consolidated |
| Net cash provided by (used in) investing activities | ¥-477.3 billion | Consolidated |
| Diluted earnings per share | 118.8 yen | Consolidated |
| Cash and cash equivalents | ¥426.1 billion | Consolidated |
| Net assets | ¥3,648.2 billion | Consolidated |
| Ordinary income (loss) | ¥377.4 billion | Consolidated |
| Total assets | ¥9,143.0 billion | Consolidated |
| Return on equity | 7.6% | Consolidated |
| Equity-to-asset ratio | 39.6% | Consolidated |
| Net income (loss) attributable to owners of parent | ¥292.8 billion | Consolidated |
| Net cash provided by (used in) financing activities | ¥-1,109.9 billion | Consolidated |
| Basic earnings (loss) per share | 118.81 yen | Consolidated |
| Net assets per share | 1,566.06 yen | Consolidated |
| Dividend per share | 50 yen | Parent only |
| Operating revenue | ¥189.0 billion | Parent only |
| Net income (loss) | ¥119.4 billion | Parent only |
| Diluted earnings per share | 48.43 yen | Parent only |
| Total number of issued shares (common stock) | 2,604,555,000 shares | Parent only |
| Net assets | ¥762.1 billion | Parent only |
| Ordinary income (loss) | ¥110.5 billion | Parent only |
| Total assets | ¥1,941.7 billion | Parent only |
| Return on equity | 11.3% | Parent only |
| Equity-to-asset ratio | 39.2% | Parent only |
| Capital stock | ¥50.0 billion | Parent only |
| Payout ratio | 103.2% | Parent only |
| Interim dividend per share | 25 yen | Parent only |
| Basic earnings (loss) per share | 48.44 yen | Parent only |
| Net assets per share | 329.55 yen | Parent only |
Employees (10 items)
| Item | Value | Consolidated / Non-consolidated |
|---|---|---|
| Number of employees | 35,967 people | Consolidated |
| Number of employees | 35,967 people | Consolidated |
| Wage gap between men and women (all employees) | 78.6% | Parent only |
| Average length of service (years) | 17.5 years | Parent only |
| Average annual salary | ¥8.55 million | Parent only |
| Average age (years) | 45.1 years old | Parent only |
| Number of employees | 866 people | Parent only |
| Number of employees | 866 people | Parent only |
| Wage gap between men and women (regular employees) | 77.5% | Parent only |
| Wage gap between men and women (non-regular employees) | 80.7% | Parent only |
Other disclosed items (15 items)
| Item | Value | Consolidated / Non-consolidated |
|---|---|---|
| Goodwill before offsetting | ¥2,109.8 billion | Consolidated |
| Net sales to external customers | ¥10,430.3 billion | Consolidated |
| Average number of temporary employees | 50,395 people | Consolidated |
| Average number of temporary employees | 50,395 people | Consolidated |
| Number of associates accounted for using equity method | 13 companies | Consolidated |
| Number of unconsolidated subsidiaries accounted for using equity method | 0 companies | Consolidated |
| Investments accounted for using equity method | ¥214.4 billion | Consolidated |
| Increase in property plant and equipment and intangible assets | ¥390.1 billion | Consolidated |
| Depreciation | ¥382.0 billion | Consolidated |
| Number of consolidated subsidiaries | 140 companies | Consolidated |
| Rate of male employees taking childcare leave (all employees) | 100.0% | Parent only |
| Average number of temporary employees | 12 people | Parent only |
| Average number of temporary employees | 12 people | Parent only |
| Total return on the share price index | 238.4% | Parent only |
| Ratio of female employees in managerial positions | 19.7% | Parent only |
Shares (22 items)
| Item | Value | Consolidated / Non-consolidated |
|---|---|---|
| Number of shares held | 1,051,807,000 shares | Consolidated |
| Total number of shares held treasury shares etc | 289,783,300 shares | Consolidated |
| Number of issues whose number of shares increased shares not listed investment shares held for purposes other than pure investment largest holding company | 1 issues | Consolidated |
| Number of issues whose number of shares decreased shares not listed investment shares held for purposes other than pure investment largest holding company | 1 issues | Consolidated |
| Number of issues whose number of shares decreased shares other than those not listed investment shares held for purposes other than pure investment reporting company | 1 issues | Consolidated |
| Total acquisition cost for increased shares shares not listed investment shares held for purposes other than pure investment largest holding company | ¥0.5 billion | Consolidated |
| Total sale amount for decreased shares shares not listed investment shares held for purposes other than pure investment largest holding company | ¥0 | Consolidated |
| Total sale amount for decreased shares shares other than those not listed investment shares held for purposes other than pure investment reporting company | ¥8.1 billion | Consolidated |
| Number of shares | 2,604,555,849 shares | Consolidated |
| Shareholding ratio treasury shares etc | 11.1% | Consolidated |
| Shareholding ratio | 45.4% | Consolidated |
| Number of shares held in own name treasury shares etc | 289,783,300 shares | Consolidated |
| Number of voting rights | 23,139,195 units | Consolidated |
| Carrying amount on the balance sheet | ¥0.5 billion | Consolidated |
| Carrying amount on the balance sheet | ¥7.3 billion | Consolidated |
| Carrying amount on the balance sheet | ¥34.2 billion | Consolidated |
| Carrying amount on the balance sheet | ¥51.5 billion | Consolidated |
| Number of issues | 5 issues | Consolidated |
| Number of issues | 9 issues | Consolidated |
| Number of issues | 5 issues | Consolidated |
| Number of issues | 15 issues | Consolidated |
| Total shareholder return | 177.9% | Parent only |
Property and facilities (1 items)
| Item | Value | Consolidated / Non-consolidated |
|---|---|---|
| Capital expenditures | ¥402.3 billion | Consolidated |
Audit (11 items)
| Item | Value | Consolidated / Non-consolidated |
|---|---|---|
| Fees for audit and attestation services - reporting company | ¥0.2 billion | Consolidated |
| Fees for audit and attestation services - total | ¥0.7 billion | Consolidated |
| Fees for audit and attestation services - total | ¥0.7 billion | Consolidated |
| Fees for audit and attestation services - consolidated subsidiaries | ¥0.7 billion | Consolidated |
| Fees for audit and attestation services - consolidated subsidiaries | ¥0.5 billion | Consolidated |
| Fees for non-audit services - reporting company | ¥0.1 billion | Consolidated |
| Fees for non-audit services - reporting company | ¥27.00 million | Consolidated |
| Fees for non-audit services - total | ¥0.2 billion | Consolidated |
| Fees for non-audit services - total | ¥37.00 million | Consolidated |
| Non audit fees consolidated subsidiaries network firms | ¥70.00 million | Consolidated |
| Non audit fees consolidated subsidiaries | ¥10.00 million | Consolidated |
Balance sheet (141 items)
| Item | Value | Consolidated / Non-consolidated |
|---|---|---|
| Other | ¥64.8 billion | Consolidated |
| Other | ¥52.4 billion | Consolidated |
| Other | ¥46.1 billion | Consolidated |
| Other | ¥183.4 billion | Consolidated |
| Other | ¥407.3 billion | Consolidated |
| Other | ¥157.5 billion | Consolidated |
| Valuation difference on available-for-sale securities | ¥55.7 billion | Consolidated |
| Other, net | ¥27.5 billion | Consolidated |
| Goodwill | ¥2,109.8 billion | Consolidated |
| Software | ¥201.7 billion | Consolidated |
| Lease obligations | ¥1,399.0 billion | Consolidated |
| Lease obligations | ¥164.8 billion | Consolidated |
| Work in process | ¥94.00 million | Consolidated |
| Retained earnings | ¥2,906.3 billion | Consolidated |
| Prepaid expenses | ¥89.3 billion | Consolidated |
| Raw materials and supplies | ¥0.3 billion | Consolidated |
| Notes receivable - trade | ¥298.7 billion | Consolidated |
| Merchandise and finished goods | ¥223.0 billion | Consolidated |
| Operating loans | ¥42.2 billion | Consolidated |
| Non-current liabilities | ¥3,594.1 billion | Consolidated |
| Non-current assets | ¥7,650.0 billion | Consolidated |
| Land | ¥902.2 billion | Consolidated |
| Contract liabilities | ¥70.7 billion | Consolidated |
| Tools, furniture and fixtures | ¥1,523.0 billion | Consolidated |
| Tools, furniture and fixtures | ¥435.3 billion | Consolidated |
| Buildings and structures | ¥2,983.0 billion | Consolidated |
| Buildings and structures, net | ¥1,449.8 billion | Consolidated |
| Construction in progress | ¥231.5 billion | Consolidated |
| Provision for directors' bonuses | ¥0.7 billion | Consolidated |
| Provision for directors' retirement benefits | ¥0.1 billion | Consolidated |
| Investments and other assets | ¥683.0 billion | Consolidated |
| Investment securities | ¥363.7 billion | Consolidated |
| Notes and accounts payable - trade | ¥223.9 billion | Consolidated |
| Property, plant and equipment | ¥4,498.0 billion | Consolidated |
| Income taxes payable | ¥37.4 billion | Consolidated |
| Accrued expenses | ¥259.0 billion | Consolidated |
| Shareholders' equity | ¥2,634.3 billion | Consolidated |
| Share award rights | ¥0.2 billion | Consolidated |
| Provision for stocks payment-NCL | ¥1.5 billion | Consolidated |
| Current liabilities | ¥1,900.7 billion | Consolidated |
| Current assets | ¥1,492.5 billion | Consolidated |
| Accumulated depreciation | ¥-18.6 billion | Consolidated |
| Accumulated depreciation | ¥-1,087.7 billion | Consolidated |
| Accumulated depreciation | ¥-1,533.2 billion | Consolidated |
| Foreign currency translation adjustment | ¥884.8 billion | Consolidated |
| Intangible assets | ¥2,469.0 billion | Consolidated |
| Cash and cash equivalents | ¥426.1 billion | Consolidated |
| Cash and deposits | ¥438.6 billion | Consolidated |
| Short-term loans payable | ¥135.6 billion | Consolidated |
| Bonds payable | ¥929.8 billion | Consolidated |
| Bond issuance cost | ¥0.4 billion | Consolidated |
| Net assets | ¥3,648.2 billion | Consolidated |
| Net assets | ¥3,648.2 billion | Consolidated |
| Total assets | ¥9,143.0 billion | Consolidated |
| Total assets | ¥9,143.0 billion | Consolidated |
| Deferred gains or losses on hedges | ¥4.6 billion | Consolidated |
| Deferred tax liabilities | ¥224.6 billion | Consolidated |
| Deferred tax assets | ¥37.1 billion | Consolidated |
| Deferred assets | ¥0.4 billion | Consolidated |
| Treasury stock | ¥-615.5 billion | Consolidated |
| Valuation and translation adjustments | ¥986.0 billion | Consolidated |
| Liabilities | ¥5,494.8 billion | Consolidated |
| Liabilities and net assets | ¥9,143.0 billion | Consolidated |
| Provision for sales promotion expenses | ¥0.3 billion | Consolidated |
| Allowance for doubtful accounts | ¥-1.6 billion | Consolidated |
| Allowance for doubtful accounts | ¥-7.0 billion | Consolidated |
| Capital surplus | ¥293.4 billion | Consolidated |
| Capital stock | ¥50.0 billion | Consolidated |
| Asset retirement obligations | ¥225.3 billion | Consolidated |
| Provision for bonuses | ¥5.4 billion | Consolidated |
| Remeasurements of defined benefit plans | ¥40.9 billion | Consolidated |
| Net defined benefit liability | ¥16.6 billion | Consolidated |
| Net defined benefit asset | ¥67.2 billion | Consolidated |
| Long-term loans payable | ¥718.5 billion | Consolidated |
| Long-term loans receivable | ¥7.1 billion | Consolidated |
| Long-term deposits received | ¥13.8 billion | Consolidated |
| Non-controlling interests | ¥27.7 billion | Consolidated |
| Deposits received | ¥177.9 billion | Consolidated |
| Current portion of bonds payable | ¥255.7 billion | Consolidated |
| Current portion of long-term loans payable | ¥190.5 billion | Consolidated |
| Other | ¥1.0 billion | Parent only |
| Other | ¥2.3 billion | Parent only |
| Other | ¥1.0 billion | Parent only |
| Other | ¥5.2 billion | Parent only |
| Other | ¥1.0 billion | Parent only |
| Valuation difference on available-for-sale securities | ¥20.3 billion | Parent only |
| Other capital surplus | ¥703.9 billion | Parent only |
| Software | ¥26.7 billion | Parent only |
| Software in progress | ¥1.4 billion | Parent only |
| Lease obligations | ¥16.7 billion | Parent only |
| Lease obligations | ¥6.0 billion | Parent only |
| Lease assets | ¥8.2 billion | Parent only |
| Lease assets, net | ¥0.5 billion | Parent only |
| Retained earnings | ¥177.6 billion | Parent only |
| Advances received | ¥0.2 billion | Parent only |
| Prepaid pension cost | ¥2.8 billion | Parent only |
| Prepaid expenses | ¥3.4 billion | Parent only |
| Non-current liabilities | ¥614.7 billion | Parent only |
| Non-current assets | ¥1,897.7 billion | Parent only |
| Land | ¥2.7 billion | Parent only |
| Buildings and structures, net | ¥2.6 billion | Parent only |
| Construction in progress | ¥76.00 million | Parent only |
| Provision for directors' bonuses | ¥0.6 billion | Parent only |
| Investments and other assets | ¥1,852.3 billion | Parent only |
| Investment securities | ¥46.0 billion | Parent only |
| Property, plant and equipment | ¥8.1 billion | Parent only |
| Accounts receivable - other | ¥30.2 billion | Parent only |
| Income taxes refund receivable | ¥0.1 billion | Parent only |
| Income taxes payable | ¥5.00 million | Parent only |
| Accrued expenses | ¥5.1 billion | Parent only |
| Accounts payable - other | ¥21.6 billion | Parent only |
| Shareholders' equity | ¥741.6 billion | Parent only |
| Share award rights | ¥0.2 billion | Parent only |
| Current liabilities | ¥565.0 billion | Parent only |
| Current assets | ¥43.7 billion | Parent only |
| Intangible assets | ¥37.3 billion | Parent only |
| Cash and deposits | ¥1.0 billion | Parent only |
| Bonds payable | ¥200.0 billion | Parent only |
| Bond issuance cost | ¥0.4 billion | Parent only |
| Net assets | ¥762.1 billion | Parent only |
| Net assets | ¥762.1 billion | Parent only |
| Total assets | ¥1,941.7 billion | Parent only |
| Deferred tax assets | ¥13.9 billion | Parent only |
| Deferred assets | ¥0.4 billion | Parent only |
| Retained earnings brought forward | ¥177.6 billion | Parent only |
| Treasury stock | ¥-615.4 billion | Parent only |
| Valuation and translation adjustments | ¥20.3 billion | Parent only |
| Liabilities | ¥1,179.7 billion | Parent only |
| Liabilities and net assets | ¥1,941.7 billion | Parent only |
| Capital surplus | ¥1,129.4 billion | Parent only |
| Legal capital surplus | ¥425.5 billion | Parent only |
| Capital stock | ¥50.0 billion | Parent only |
| Provision for bonuses | ¥0.4 billion | Parent only |
| Vehicles tools furniture and fixtures net | ¥2.1 billion | Parent only |
| Long-term loans payable | ¥393.5 billion | Parent only |
| Long-term deposits received | ¥1.7 billion | Parent only |
| Shares of subsidiaries and associates | ¥1,783.7 billion | Parent only |
| Affiliated company short-term loans payable | ¥382.5 billion | Parent only |
| Long term loans payable to subsidiaries and affiliates | ¥14.00 million | Parent only |
| Current portion of bonds payable | ¥60.0 billion | Parent only |
| Current portion of long-term loans payable | ¥84.2 billion | Parent only |
Accounts unique to this company (32 items)
| Item | Value | Consolidated / Non-consolidated |
|---|---|---|
| Revenue | ¥1,994.1 billion | Consolidated |
| Revenue | ¥-542.5 billion | Consolidated |
| Revenue | ¥1,451.7 billion | Consolidated |
| Revenue | ¥157.1 billion | Consolidated |
| Revenue | ¥192.2 billion | Consolidated |
| Revenue | ¥3.3 billion | Consolidated |
| Revenue | ¥81.7 billion | Consolidated |
| Revenue | ¥615.1 billion | Consolidated |
| Revenue | ¥152.5 billion | Consolidated |
| Revenue | ¥26.9 billion | Consolidated |
| Revenue | ¥0.9 billion | Consolidated |
| Revenue | ¥-26.9 billion | Consolidated |
| Revenue | ¥10.0 billion | Consolidated |
| Revenue | ¥28.8 billion | Consolidated |
| Revenue | ¥-100.0 billion | Consolidated |
| Revenue | ¥-42.0 billion | Consolidated |
| Revenue | ¥-5.0 billion | Consolidated |
| Revenue | ¥2,230.0 billion | Consolidated |
| Revenue | ¥32.8 billion | Consolidated |
| Revenue | ¥3.7 billion | Parent only |
| Revenue | ¥3.6 billion | Parent only |
| Revenue | ¥3.3 billion | Parent only |
| Revenue | ¥0.9 billion | Parent only |
| Revenue | ¥0.9 billion | Parent only |
| Revenue | ¥182.2 billion | Parent only |
| Revenue | ¥3.9 billion | Parent only |
| Revenue | ¥2.2 billion | Parent only |
| Revenue | ¥1.9 billion | Parent only |
| Revenue | ¥4.7 billion | Parent only |
| Revenue | ¥4.1 billion | Parent only |
| Revenue | ¥7.4 billion | Parent only |
| Revenue | ¥23.6 billion | Parent only |
Statement of income (101 items)
| Item | Value | Consolidated / Non-consolidated |
|---|---|---|
| Other | ¥3.6 billion | Consolidated |
| Other | ¥9.6 billion | Consolidated |
| Other | ¥15.5 billion | Consolidated |
| Other | ¥29.5 billion | Consolidated |
| Other | ¥770.7 billion | Consolidated |
| Other comprehensive income | ¥-2.8 billion | Consolidated |
| Other changes | ¥-0.8 billion | Consolidated |
| Valuation difference on available for sale securities net of tax | ¥2.9 billion | Consolidated |
| Amortization of goodwill | ¥137.9 billion | Consolidated |
| Amortization of goodwill | ¥137.9 billion | Consolidated |
| Dividends from surplus | ¥-113.6 billion | Consolidated |
| Comprehensive income | ¥296.3 billion | Consolidated |
| Insurance | ¥0.3 billion | Consolidated |
| Interest income | ¥11.1 billion | Consolidated |
| Dividend income | ¥1.9 billion | Consolidated |
| Operating income | ¥423.0 billion | Consolidated |
| Operating income | ¥423.0 billion | Consolidated |
| Operating receipts | ¥1,536.6 billion | Consolidated |
| Operating revenue | ¥10,430.3 billion | Consolidated |
| Operating revenue | ¥10,430.3 billion | Consolidated |
| Non-operating income | ¥18.8 billion | Consolidated |
| Non-operating expenses | ¥64.4 billion | Consolidated |
| Net cash provided by (used in) operating activities | ¥666.7 billion | Consolidated |
| Operating gross profit | ¥3,130.0 billion | Consolidated |
| Gain on sales of non-current assets | ¥94.6 billion | Consolidated |
| Loss on disposal of property, plant and equipment | ¥22.5 billion | Consolidated |
| Rents | ¥452.0 billion | Consolidated |
| Cost of sales | ¥7,300.2 billion | Consolidated |
| Gross profit (loss) | ¥1,593.5 billion | Consolidated |
| Net sales | ¥8,893.7 billion | Consolidated |
| Net income | ¥292.8 billion | Consolidated |
| Net income | ¥292.8 billion | Consolidated |
| Net income (loss) | ¥299.1 billion | Consolidated |
| Net income (loss) | ¥299.1 billion | Consolidated |
| Gain on sales of investment securities | ¥5.5 billion | Consolidated |
| Gain on valuation of investment securities | ¥2.2 billion | Consolidated |
| Net cash provided by (used in) investing activities | ¥-477.3 billion | Consolidated |
| Share of loss of investments accounted for using equity method | ¥5.3 billion | Consolidated |
| Share of other comprehensive income of investments accounted for using equity method | ¥9.8 billion | Consolidated |
| Interest expenses | ¥29.8 billion | Consolidated |
| Utilities expenses | ¥172.6 billion | Consolidated |
| Income taxes - current | ¥114.4 billion | Consolidated |
| Income taxes | ¥135.5 billion | Consolidated |
| Income taxes - deferred | ¥21.1 billion | Consolidated |
| Legal and employee benefits expenses | ¥65.7 billion | Consolidated |
| Depreciation | ¥370.9 billion | Consolidated |
| Impairment loss | ¥32.8 billion | Consolidated |
| Foreign currency translation adjustment net of tax | ¥-23.0 billion | Consolidated |
| Extraordinary income | ¥142.9 billion | Consolidated |
| Extraordinary loss | ¥85.8 billion | Consolidated |
| Effect of exchange rate change on cash and cash equivalents | ¥-3.2 billion | Consolidated |
| Net increase (decrease) in cash and cash equivalents | ¥-923.7 billion | Consolidated |
| Interest on bonds | ¥19.7 billion | Consolidated |
| Income (loss) before income taxes | ¥434.6 billion | Consolidated |
| Income (loss) before income taxes | ¥434.6 billion | Consolidated |
| Ordinary income | ¥377.4 billion | Consolidated |
| Deferred gains or losses on hedges net of tax | ¥-0.4 billion | Consolidated |
| Disposal of treasury stock | ¥1.6 billion | Consolidated |
| Purchase of treasury stock | ¥-600.0 billion | Consolidated |
| Comprehensive income attributable to owners of parent | ¥297.0 billion | Consolidated |
| Net cash provided by (used in) financing activities | ¥-1,109.9 billion | Consolidated |
| Selling, general and administrative expenses | ¥2,707.0 billion | Consolidated |
| Provision for bonuses | ¥15.0 billion | Consolidated |
| Remeasurements of defined benefit plans net of tax | ¥7.9 billion | Consolidated |
| Retirement benefit expenses | ¥10.9 billion | Consolidated |
| Comprehensive income attributable to non-controlling interests | ¥-0.8 billion | Consolidated |
| Net income (loss) attributable to non-controlling interests | ¥6.3 billion | Consolidated |
| Other | ¥0.1 billion | Parent only |
| Other | ¥0.3 billion | Parent only |
| Other | ¥7.00 million | Parent only |
| Other | ¥2.0 billion | Parent only |
| Other revenue form operatione | ¥0.7 billion | Parent only |
| General and administrative expenses | ¥70.5 billion | Parent only |
| Reversal of provision for loss on guarantees | ¥2.6 billion | Parent only |
| Dividends from surplus | ¥-113.6 billion | Parent only |
| Interest income | ¥80.00 million | Parent only |
| Dividend income | ¥0.7 billion | Parent only |
| Operating income | ¥118.5 billion | Parent only |
| Operating revenue | ¥189.0 billion | Parent only |
| Non-operating income | ¥0.9 billion | Parent only |
| Non-operating expenses | ¥8.9 billion | Parent only |
| Loss on disposal of property, plant and equipment | ¥0.3 billion | Parent only |
| Net income (loss) | ¥119.4 billion | Parent only |
| Net income (loss) | ¥119.4 billion | Parent only |
| Gain on sales of investment securities | ¥4.9 billion | Parent only |
| Interest expenses | ¥6.2 billion | Parent only |
| Commission fees | ¥11.4 billion | Parent only |
| Income taxes - current | ¥-32.8 billion | Parent only |
| Income taxes | ¥-23.1 billion | Parent only |
| Income taxes - deferred | ¥9.7 billion | Parent only |
| Depreciation | ¥14.1 billion | Parent only |
| Impairment loss | ¥12.7 billion | Parent only |
| Extraordinary income | ¥9.5 billion | Parent only |
| Extraordinary loss | ¥23.7 billion | Parent only |
| Interest on bonds | ¥2.4 billion | Parent only |
| Income (loss) before income taxes | ¥96.3 billion | Parent only |
| Ordinary income | ¥110.5 billion | Parent only |
| Disposal of treasury stock | ¥1.6 billion | Parent only |
| Purchase of treasury stock | ¥-600.0 billion | Parent only |
| Provision for bonuses | ¥0.4 billion | Parent only |
| Retirement benefit expenses | ¥0.3 billion | Parent only |
Statement of changes in equity (4 items)
| Item | Value | Consolidated / Non-consolidated |
|---|---|---|
| Total changes during the period | ¥-575.0 billion | Consolidated |
| Net changes in items other than shareholders' equity | ¥-155.0 billion | Consolidated |
| Total changes during the period | ¥-587.6 billion | Parent only |
| Net changes in items other than shareholders' equity | ¥5.0 billion | Parent only |
Statement of cash flows (47 items)
| Item | Value | Consolidated / Non-consolidated |
|---|---|---|
| Other | ¥-51.1 billion | Consolidated |
| Other | ¥-18.1 billion | Consolidated |
| Other | ¥-15.1 billion | Consolidated |
| Amortization of goodwill | ¥137.9 billion | Consolidated |
| Increase decrease in notes and accounts payable trade | ¥6.0 billion | Consolidated |
| Proceeds from insurance income | ¥2.8 billion | Consolidated |
| Interest expenses paid | ¥-52.5 billion | Consolidated |
| Interest and dividends income received | ¥14.2 billion | Consolidated |
| Insurance | ¥-0.3 billion | Consolidated |
| Interest and dividend income | ¥-13.0 billion | Consolidated |
| Decrease increase in operating loans receivable | ¥-10.7 billion | Consolidated |
| Gain on sales of non-current assets | ¥-94.6 billion | Consolidated |
| Loss on disposal of property, plant and equipment | ¥23.1 billion | Consolidated |
| Decrease increase in notes and accounts receivable trade | ¥-17.7 billion | Consolidated |
| Proceeds from withdrawal of time deposits | ¥6.4 billion | Consolidated |
| Payments into time deposits | ¥-4.5 billion | Consolidated |
| Subtotal | ¥788.4 billion | Consolidated |
| Proceeds from collection of guarantee deposits | ¥20.8 billion | Consolidated |
| Payments for guarantee deposits | ¥-5.3 billion | Consolidated |
| Purchase of investment securities | ¥-46.6 billion | Consolidated |
| Proceeds from sales of investment securities | ¥56.0 billion | Consolidated |
| Loss (gain) on sales of long-term investment securities | ¥-5.5 billion | Consolidated |
| Equity in earnings losses of affiliates | ¥5.3 billion | Consolidated |
| Interest expenses and interest on bonds | ¥49.5 billion | Consolidated |
| Purchase of property plant and equipment | ¥-333.6 billion | Consolidated |
| Proceeds from sales of property plant and equipment | ¥143.6 billion | Consolidated |
| Decrease (increase) in inventories | ¥12.0 billion | Consolidated |
| Income taxes paid | ¥-88.6 billion | Consolidated |
| Income taxes refund | ¥2.4 billion | Consolidated |
| Depreciation | ¥382.0 billion | Consolidated |
| Impairment loss | ¥32.8 billion | Consolidated |
| Purchase of intangible assets | ¥-70.7 billion | Consolidated |
| Decrease/increase in short-term loans payable | ¥-39.7 billion | Consolidated |
| Redemption of bonds | ¥-210.0 billion | Consolidated |
| Regarding purchase of treasury stock | ¥-600.0 billion | Consolidated |
| Increase (decrease) in provision for bonuses | ¥0.9 billion | Consolidated |
| Inorease (decrease) in asset for retirement benefits | ¥-7.0 billion | Consolidated |
| Proceeds from sales of shares of subsidiaries resulting in change in scope of consolidation | ¥538.4 billion | Consolidated |
| Payments for sale of shares of subsidiaries resulting in change in scope of consolidation | ¥-758.6 billion | Consolidated |
| Payments from changes in ownership interests in subsidiaries that do not result in change in scope of consolidation | ¥-0 | Consolidated |
| Dividends | ¥-113.6 billion | Consolidated |
| Proceeds from long term loans payable | ¥144.7 billion | Consolidated |
| Repayment of long term loans payable | ¥-271.7 billion | Consolidated |
| Dividends paid to non-controlling interests | ¥-4.4 billion | Consolidated |
| Proceeds from guarantee deposits received | ¥1.3 billion | Consolidated |
| Repayments of guarantee deposits received | ¥-1.3 billion | Consolidated |
| Increase (decrease) in deposits | ¥34.3 billion | Consolidated |
Basic indicators
| Item | Value | Consolidated / Non-consolidated | Source |
|---|---|---|---|
| Net cash provided by (used in) operating activities | ¥666.7 billion | Consolidated | Disclosed |
| Dividend per share | 50 | Parent only | Disclosed |
| Number of employees | 35,967 | Consolidated | Disclosed |
| Net assets | ¥3,648.2 billion | Consolidated | Disclosed |
| Net sales | ¥8,893.7 billion | Consolidated | Disclosed |
| Operating income | ¥423.0 billion | Consolidated | Disclosed |
| Operating revenue | ¥10,430.3 billion | Consolidated | Disclosed |
| Ordinary income | ¥377.4 billion | Consolidated | Disclosed |
| Net income | ¥292.8 billion | Consolidated | Disclosed |
| Total assets | ¥9,143.0 billion | Consolidated | Disclosed |
| Operating margin | 4.1% | Consolidated | Calculated |
| Net margin | 2.8% | Consolidated | Calculated |
| Sales per employee | 289995524 yen | Consolidated | Calculated |
| Total asset turnover | 1.14 times | Consolidated | Calculated |
| Net assets to total assets | 39.9% | Consolidated | Calculated |