AEON
AEON Co.,Ltd.
Company highlights
A retailer that does not earn most on the shop floor.
Vol.5, Chapter 1 (as of 2026-08-24)
Key figures
Period Mar 2025 to Feb 2026ConsolidatedJapanese GAAP
Business revenue model
Featured in
Vol.5, Chapter 1 (as of 2026-08-24)
“Kaisha no Shikumi: Earning Beyond the Till”, Chapter 1: AEON and Seven Bank: One Kept Its Finance Arm and Its Malls, the Other Took Its Bank Off the Books
Book’s reference date 2026-08-24 / data last checked 2026-10-20
Key points in this volumeA company's profits depend not just on what it sells, but on who pays, and what they pay for.
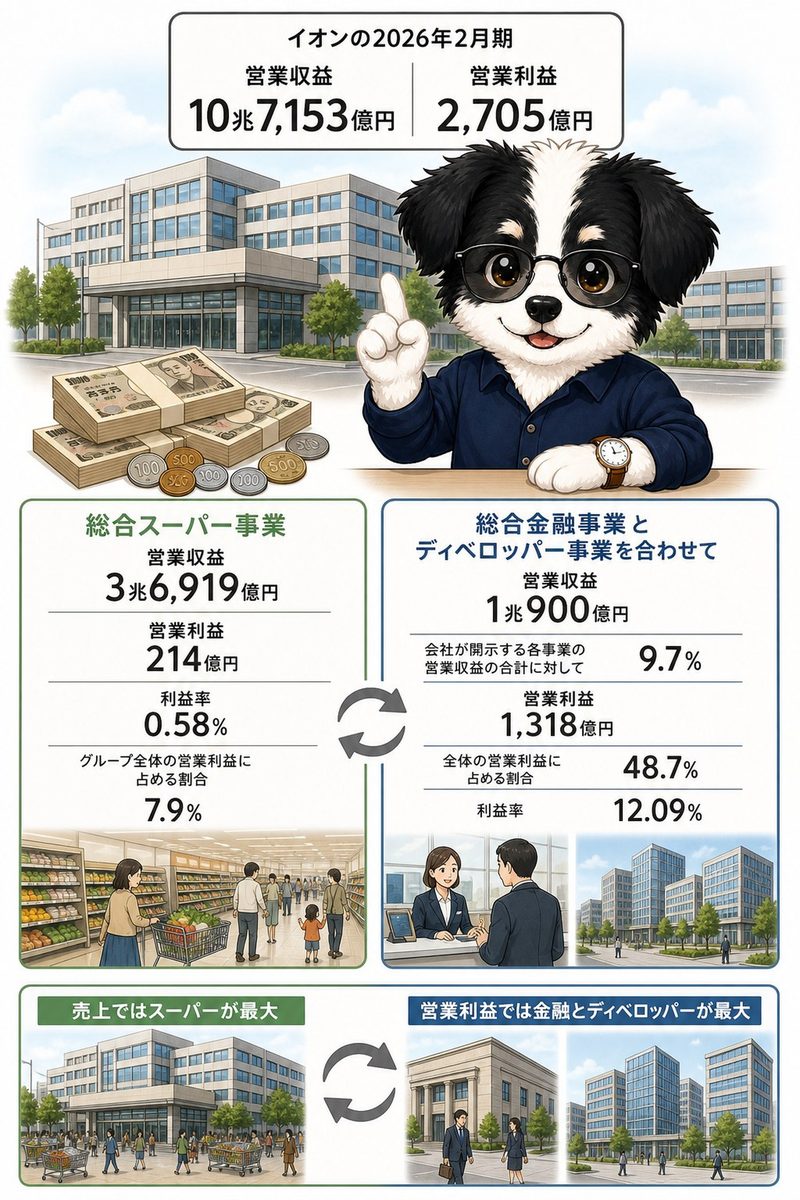
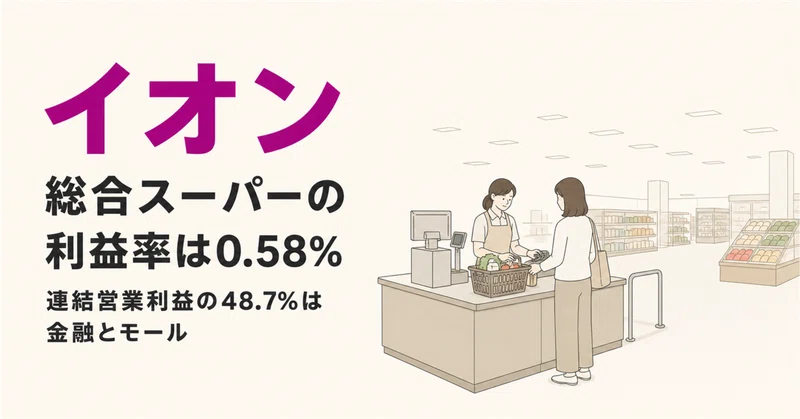
Of ¥10,715.3 billion in operating revenue, the largest piece is the GMS business at ¥3,691.9 billion. Yet the GMS business has an operating margin of only 0.58%.
Measured by operating income, the financial services business and the developer business together account for 48.7%. Sales are largest on the shop floor, while profit leans towards finance and property (ratios calculated).
The move that changed AEON
Take the malls into full ownership, and take a drugstore chain into the group through a tender offer.
In July 2025, AEON made AEON Mall a wholly owned subsidiary through a share exchange. AEON Mall is the company that receives property rental income from tenants. It then acquired shares in the drugstore chain Tsuruha Holdings through a tender offer running from December 2025 into January 2026, and consolidated it as of January 14, 2026. Its holding after the tender offer was 228.63 million shares, or 50.11% of the voting rights.
Coverage in the book
- What Does AEON Earn From?
- The Rent Goes to AEON Mall
- The Cards Sit at AEON Financial Service, the Deposits at AEON Bank
- Operating Profit by Segment Over Ten Fiscal Years
- The Capital Moves of 2025 and 2026
Related books, articles and videos
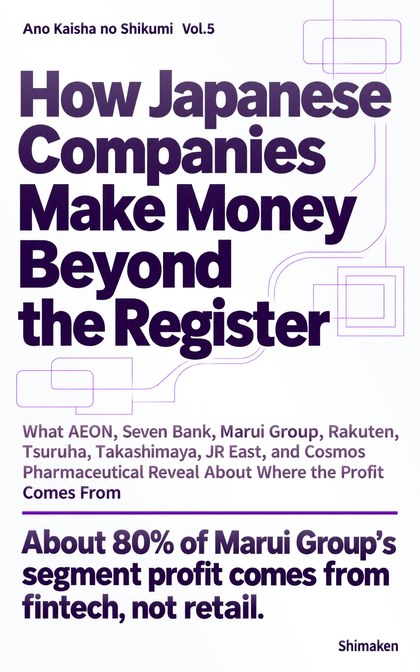 “Kaisha no Shikumi: Earning Beyond the Till”
Chapter 1: AEON
“AEON and Seven Bank: One Kept Its Finance Arm and Its Malls, the Other Took Its Bank Off the Books”
“Ano Kaisha no Shikumi” series, Vol.5 — Kindle and paperback
Find it on Amazon →
Company profile
Tables scroll sideways
Disclosed data
Business activities and revenue composition
AEON
Revenue and profit by business segment
Period Mar 2025 to Feb 2026Source Annual securities reportsConsolidated・Disclosed
| Business | Net sales to external customers | Operating income | |||||
|---|---|---|---|---|---|---|---|
| This year | Share | Last year | This year | Share | Margin | Last year | |
| GMS | ¥3,604.9 billion | 33.5% | ¥3,460.7 billion | ¥21.4 billion | 7.7% | 0.6% | ¥16.4 billion |
| Supermarket | ¥3,070.4 billion | 28.6% | ¥3,039.8 billion | ¥29.9 billion | 10.7% | 1.0% | ¥32.5 billion |
| Health and Wellness | ¥1,632.5 billion | 15.2% | ¥1,322.0 billion | ¥52.4 billion | 18.7% | 3.2% | ¥36.0 billion |
| International | ¥563.6 billion | 5.2% | ¥544.3 billion | ¥10.2 billion | 3.7% | 1.8% | ¥9.5 billion |
| Service, Specialty Store | ¥531.9 billion | 4.9% | ¥521.2 billion | ¥27.0 billion | 9.6% | 5.1% | ¥23.3 billion |
| Financial services | ¥486.2 billion | 4.5% | ¥467.0 billion | ¥60.9 billion | 21.7% | 12.5% | ¥61.2 billion |
| SC development | ¥431.5 billion | 4.0% | ¥409.3 billion | ¥70.9 billion | 25.3% | 16.4% | ¥53.0 billion |
| Discount Store | ¥429.2 billion | 4.0% | ¥410.2 billion | ¥7.2 billion | 2.6% | 1.7% | ¥8.0 billion |
| Total of the businesses | ¥10,750.2 billion | 100.0% | ¥279.9 billion | 100.0% | |||
Revenue and profit
Amounts by account
| Group | Account | Amount | Consolidated / Non-consolidated |
|---|---|---|---|
| Selling, general and administrative expenses | Employees' salaries and compensation | ¥1,290.2 billion | Consolidated |
| Other | ¥564.7 billion | Consolidated | |
| Rents | ¥464.2 billion | Consolidated | |
| Depreciation | ¥342.1 billion | Consolidated | |
| Utilities expenses | ¥231.5 billion | Consolidated | |
| Repair and maintenance | ¥226.8 billion | Consolidated | |
| Legal and employee benefits expenses | ¥223.7 billion | Consolidated | |
| Advertising expenses | ¥137.6 billion | Consolidated | |
| Provision of allowance for doubtful accounts | ¥88.8 billion | Consolidated | |
| Provision for bonuses | ¥50.8 billion | Consolidated | |
| Amortization of goodwill | ¥19.6 billion | Consolidated | |
| Investigation and research expenses | ¥6.0 billion | Parent only | |
| Profit by stage | Gross profit (loss) | ¥2,649.2 billion | Consolidated |
| Operating income | ¥270.5 billion | Consolidated | |
| Ordinary income | ¥243.0 billion | Consolidated | |
| Net income | ¥72.7 billion | Consolidated |
AEON
Selling, general and administrative expenses
Period Mar 2025 to Feb 2026Source Annual securities reports
- Employees' salaries and compensation ¥1,290.2 billion
- Other ¥564.7 billion
- Rents ¥464.2 billion
- Depreciation ¥342.1 billion
- Utilities expenses ¥231.5 billion
- Repair and maintenance ¥226.8 billion
Performance, financial position and capital allocation
Long-term changes in performance
AEON
Long-term revenue, profit and asset trends
Period 2013 to 2026Source Annual securities reportsDisclosed
AEON
Recent performance trends
Source Annual securities reports
Year-on-year comparison
| Item | 2022 | 2023 | 2024 | 2025 | 2026 |
|---|---|---|---|---|---|
| Operating revenue | ¥8,716.0B | ¥9,116.8B | ¥9,553.6B | ¥10,134.9B | ¥10,715.3B |
| Year on year (%) | +1.3% | +4.6% | +4.8% | +6.1% | +5.7% |
| Ordinary income (loss) | ¥167.1B | ¥203.7B | ¥237.5B | ¥224.2B | ¥243.0B |
| Change from prior year | +20.4% | +21.9% | +16.6% | -5.6% | +8.4% |
| Ordinary income (loss) as a share of Operating revenue | 1.9% | 2.2% | 2.5% | 2.2% | 2.3% |
| Change (percentage points) | +0.3 points | +0.3 points | +0.3 points | -0.3 points | +0.1 points |
AEON
Earnings and net assets per share over time
Unit yenSource Annual securities reports
AEON
Return on equity over time
Unit %Source Annual securities reports
Consolidated indicators (15 items)
| Item | 4 years ago | 3 years ago | 2 years ago | Last year | This year |
|---|---|---|---|---|---|
| Operating revenue | ¥8,716.0 billion | ¥9,116.8 billion | ¥9,553.6 billion | ¥10,134.9 billion | ¥10,715.3 billion |
| Ordinary income (loss) | ¥167.1 billion | ¥203.7 billion | ¥237.5 billion | ¥224.2 billion | ¥243.0 billion |
| Net income (loss) attributable to owners of parent | ¥6.5 billion | ¥21.4 billion | ¥44.7 billion | ¥27.2 billion | ¥72.7 billion |
| Comprehensive income | ¥92.6 billion | ¥126.5 billion | ¥188.3 billion | ¥75.8 billion | ¥177.3 billion |
| Net assets | ¥1,812.4 billion | ¥1,970.2 billion | ¥2,087.2 billion | ¥2,135.3 billion | ¥2,204.3 billion |
| Total assets | ¥11,633.1 billion | ¥12,341.5 billion | ¥12,940.9 billion | ¥13,833.3 billion | ¥15,369.7 billion |
| Net assets per share | 376.92 yen | 387.04 yen | 410.53 yen | 411.65 yen | 440.4 yen |
| Basic earnings (loss) per share | 2.56 yen | 8.37 yen | 17.42 yen | 10.57 yen | 26.87 yen |
| Diluted earnings per share | 2.55 yen | 8.36 yen | 17.4 yen | 10.55 yen | 26.85 yen |
| Equity-to-asset ratio | 8.2% | 8.0% | 8.1% | 7.7% | 7.9% |
| Return on equity | 0.7% | 2.2% | 4.4% | 2.6% | 6.4% |
| Net cash provided by (used in) operating activities | ¥204.5 billion | ¥433.7 billion | ¥368.5 billion | ¥566.2 billion | ¥1,126.6 billion |
| Net cash provided by (used in) investing activities | ¥-343.9 billion | ¥-335.1 billion | ¥-508.9 billion | ¥-478.8 billion | ¥-1,088.7 billion |
| Net cash provided by (used in) financing activities | ¥-2.2 billion | ¥1.9 billion | ¥-15.9 billion | ¥0.9 billion | ¥40.1 billion |
| Cash and cash equivalents | ¥1,090.9 billion | ¥1,214.5 billion | ¥1,064.1 billion | ¥1,172.1 billion | ¥1,263.1 billion |
Parent only indicators (15 items)
| Item | 4 years ago | 3 years ago | 2 years ago | Last year | This year |
|---|---|---|---|---|---|
| Operating revenue | ¥51.9 billion | ¥55.4 billion | ¥68.0 billion | ¥73.2 billion | ¥91.1 billion |
| Ordinary income (loss) | ¥17.0 billion | ¥13.7 billion | ¥26.2 billion | ¥31.7 billion | ¥32.1 billion |
| Net income (loss) | ¥23.4 billion | ¥17.7 billion | ¥22.1 billion | ¥40.2 billion | ¥25.0 billion |
| Capital stock | ¥220.0 billion | ¥220.0 billion | ¥220.0 billion | ¥220.0 billion | ¥220.0 billion |
| Total number of issued shares (common stock) | 871,924,000 shares | 871,924,000 shares | 871,924,000 shares | 871,924,000 shares | 2,783,529,000 shares |
| Net assets | ¥653.4 billion | ¥650.5 billion | ¥666.6 billion | ¥635.9 billion | ¥911.7 billion |
| Total assets | ¥1,575.7 billion | ¥1,554.2 billion | ¥1,709.9 billion | ¥1,880.5 billion | ¥2,416.7 billion |
| Net assets per share | 257.07 yen | 253.49 yen | 259.46 yen | 245.94 yen | 328.98 yen |
| Dividend per share | 36 yen | 36 yen | 36 yen | 40 yen | 13.7 yen |
| Interim dividend per share | 18 yen | 18 yen | 18 yen | 20 yen | 6.7 yen |
| Basic earnings (loss) per share | 9.21 yen | 6.94 yen | 8.62 yen | 15.64 yen | 9.23 yen |
| Diluted earnings per share | 9.21 yen | 6.94 yen | 8.62 yen | 15.64 yen | 9.22 yen |
| Equity-to-asset ratio | 41.4% | 41.8% | 39.0% | 33.8% | 37.7% |
| Return on equity | 3.6% | 2.7% | 3.3% | 6.3% | 2.7% |
| Payout ratio | 130.3% | 172.8% | 139.3% | 85.2% | 148.5% |
Dividend history
| Fiscal year | Annual dividend per share | Of which interim | Payout ratio (as reported, parent only) | Flag |
|---|---|---|---|---|
| FY ending 2/2026 | ¥13.7 | ¥6.7 | 148.5% | Stock split or share consolidation noted |
| FY ending 2/2025 | ¥40 | ¥20 | 85.2% | |
| FY ending 2/2024 | ¥36 | ¥18 | 139.3% | |
| FY ending 2/2023 | ¥36 | ¥18 | 172.8% | |
| FY ending 2/2022 | ¥36 | ¥18 | 130.3% | |
| FY ending 2/2021 | ¥36 | ¥18 | 428.4% | |
| FY ending 2/2020 | ¥36 | ¥18 | 108.6% | |
| FY ending 2/2019 | ¥34 | ¥17 | 161.8% | |
| FY ending 2/2018 | ¥30 | ¥15 | 148.6% | |
| FY ending 2/2017 | ¥30 | ¥15 | 209.1% | |
| FY ending 2/2016 | ¥28 | ¥14 | 42.9% | |
| FY ending 2/2015 | ¥28 | ¥14 | 88.6% | |
| FY ending 2/2014 | ¥26 | ¥13 | 82.2% | |
| FY ending 2/2013 | ¥24 | ¥12 | 64.8% |
AEON
Dividends per share over time
Unit yenSource Annual securities reports
Shareholder composition
Share ownership by holder category
AEON
Unit %Source Annual securities reports
- Financial institutions34.50%
- Securities firms1.50%
- Other corporations14.80%
- Foreign holders (institutions)19.30%
- Foreign holders (individuals)0.00%
- Individuals and others30.00%
Major shareholders
| Rank | Shareholder | Shareholding ratio | Shares held |
|---|---|---|---|
| 1 | 日本マスタートラスト信託銀行株式会社(信託口)) | 12.75% | 353,095,000 |
| 2 | 株式会社日本カストディ銀行(信託口) | 3.91% | 108,353,000 |
| 3 | 株式会社みずほ銀行 | 3.68% | 102,023,000 |
| 4 | 公益財団法人岡田文化財団 | 2.39% | 66,210,000 |
| 5 | 公益財団法人イオン環境財団 | 2.36% | 65,454,000 |
| 6 | 農林中央金庫 | 2.04% | 56,545,000 |
| 7 | JP MORGAN CHASE BANK 385781(常任代理人 株式会社みずほ銀行決済営業部) | 1.32% | 36,495,000 |
| 8 | 公益財団法人イオンワンパーセントクラブ | 1.26% | 34,899,000 |
| 9 | STATE STREET BANK AND TRUSTCOMPANY 505001(常任代理人 株式会社みずほ銀行決済営業部) | 1.21% | 33,514,000 |
| 10 | イオン共済会(野村証券口) | 1.21% | 33,465,000 |
Research and development expenses and capital expenditure
| Fiscal year | Capital expenditure |
|---|---|
| FY ending 2/2026 | ¥543.0 billion |
| FY ending 2/2021 | ¥318.2 billion |
Research and development expenses and capital expenditure by segment (FY ending 2/2026)
| Segment | Capital expenditure |
|---|---|
| GMS | ¥151.0 billion |
| Supermarket | ¥66.7 billion |
| Health and Wellness | ¥24.3 billion |
| International | ¥41.8 billion |
| Service, Specialty Store | ¥31.3 billion |
| Financial services | ¥45.8 billion |
| Discount Store | ¥13.8 billion |
Revenue scale in the same industry
AEON
Source Annual securities reports of each company
Retail Trade: 343 companies · revenue · largest first・each company’s latest fiscal year・Consolidated・Disclosed
- 1 AEONThis companyFY Feb 2026 ¥10.7T
- 2 Seven & iFY Feb 2026 ¥10.4T
- 3 FAST RETAILINGFY Aug 2025 ¥3.4T
- … 340 companies
Workforce information
Women 16.2 yrs Average length of service by gender
Women 175 Employees by gender
Administrative filings and published information
Workplace information filings
| Item | Value |
|---|---|
| Employees | 559 |
| Average monthly overtime (statutory overtime plus work on statutory days off) |
13.1 hours |
| Annual paid leave taken (all employees) | 69.3% |
| Childcare leave taken, men |
83.3% |
| Childcare leave taken, women |
100% |
| Share of managers who are women | 18.1% |
| Share of board members who are women | 11.1% |
Greenhouse gas emissions
| Category | Emissions |
|---|---|
| 特定事業所排出者 | 3,723 t-CO2 |
Audit and disclosure information
| Item | Value |
|---|---|
| Audit firm | 有限責任監査法人トーマツ |
| Audit fees (this year, total) | ¥2.7 billion |
| Non-audit fees (this year, total) | ¥80.00 million |
| Audit fees (this year, network firms) | ¥0.5 billion |
| Non-audit fees (this year, network firms) | ¥0.1 billion |
| Going concern note | Cannot be determined |
| Accounting standard | Japanese GAAP |
Sources and methodology
Retrieved disclosed figures
Major management indicators (5 years) (30 items)
| Item | Value | Consolidated / Non-consolidated |
|---|---|---|
| Comprehensive income | ¥177.3 billion | Consolidated |
| Operating revenue | ¥10,715.3 billion | Consolidated |
| Net cash provided by (used in) operating activities | ¥1,126.6 billion | Consolidated |
| Net cash provided by (used in) investing activities | ¥-1,088.7 billion | Consolidated |
| Diluted earnings per share | 26.85 yen | Consolidated |
| Cash and cash equivalents | ¥1,263.1 billion | Consolidated |
| Net assets | ¥2,204.3 billion | Consolidated |
| Ordinary income (loss) | ¥243.0 billion | Consolidated |
| Total assets | ¥15,369.7 billion | Consolidated |
| Return on equity | 6.4% | Consolidated |
| Equity-to-asset ratio | 7.9% | Consolidated |
| Net income (loss) attributable to owners of parent | ¥72.7 billion | Consolidated |
| Net cash provided by (used in) financing activities | ¥40.1 billion | Consolidated |
| Basic earnings (loss) per share | 26.87 yen | Consolidated |
| Net assets per share | 440.4 yen | Consolidated |
| Dividend per share | 13.7 yen | Parent only |
| Operating revenue | ¥91.1 billion | Parent only |
| Net income (loss) | ¥25.0 billion | Parent only |
| Diluted earnings per share | 9.22 yen | Parent only |
| Total number of issued shares (common stock) | 2,783,529,000 shares | Parent only |
| Net assets | ¥911.7 billion | Parent only |
| Ordinary income (loss) | ¥32.1 billion | Parent only |
| Total assets | ¥2,416.7 billion | Parent only |
| Return on equity | 2.7% | Parent only |
| Equity-to-asset ratio | 37.7% | Parent only |
| Capital stock | ¥220.0 billion | Parent only |
| Payout ratio | 148.5% | Parent only |
| Interim dividend per share | 6.7 yen | Parent only |
| Basic earnings (loss) per share | 9.23 yen | Parent only |
| Net assets per share | 328.98 yen | Parent only |
Employees (10 items)
| Item | Value | Consolidated / Non-consolidated |
|---|---|---|
| Number of employees | 179,230 people | Consolidated |
| Number of employees | 179,230 people | Consolidated |
| Wage gap between men and women (all employees) | 63.3% | Parent only |
| Average length of service (years) | 18.5 years | Parent only |
| Average annual salary | ¥9.33 million | Parent only |
| Average age (years) | 49.3 years old | Parent only |
| Number of employees | 559 people | Parent only |
| Number of employees | 559 people | Parent only |
| Wage gap between men and women (regular employees) | 71.2% | Parent only |
| Wage gap between men and women (non-regular employees) | 114.3% | Parent only |
Other disclosed items (15 items)
| Item | Value | Consolidated / Non-consolidated |
|---|---|---|
| Goodwill before offsetting | ¥270.8 billion | Consolidated |
| Net sales to external customers | ¥10,715.3 billion | Consolidated |
| Average number of temporary employees | 290,601 people | Consolidated |
| Average number of temporary employees | 290,601 people | Consolidated |
| Number of associates accounted for using equity method | 21 companies | Consolidated |
| Equity in earnings losses of affiliates | ¥9.1 billion | Consolidated |
| Investments accounted for using equity method | ¥76.4 billion | Consolidated |
| Increase in property plant and equipment and intangible assets | ¥629.5 billion | Consolidated |
| Depreciation | ¥362.9 billion | Consolidated |
| Number of consolidated subsidiaries | 312 companies | Consolidated |
| Rate of male employees taking childcare leave (all employees) | 83.3% | Parent only |
| Average number of temporary employees | 22 people | Parent only |
| Average number of temporary employees | 22 people | Parent only |
| Total return on the share price index | 238.4% | Parent only |
| Ratio of female employees in managerial positions | 18.1% | Parent only |
Shares (22 items)
| Item | Value | Consolidated / Non-consolidated |
|---|---|---|
| Number of shares held | 890,058,000 shares | Consolidated |
| Total number of shares held treasury shares etc | 17,760,600 shares | Consolidated |
| Number of issues whose number of shares increased shares other than those not listed investment shares held for purposes other than pure investment reporting company | 2 issues | Consolidated |
| Number of issues whose number of shares decreased shares not listed investment shares held for purposes other than pure investment reporting company | 3 issues | Consolidated |
| Number of issues whose number of shares decreased shares other than those not listed investment shares held for purposes other than pure investment reporting company | 3 issues | Consolidated |
| Total acquisition cost for increased shares shares other than those not listed investment shares held for purposes other than pure investment reporting company | ¥2.9 billion | Consolidated |
| Total sale amount for decreased shares shares not listed investment shares held for purposes other than pure investment reporting company | ¥10.00 million | Consolidated |
| Total sale amount for decreased shares shares other than those not listed investment shares held for purposes other than pure investment reporting company | ¥0.2 billion | Consolidated |
| Number of shares | 2,783,529,021 shares | Consolidated |
| Shareholding ratio treasury shares etc | 0.6% | Consolidated |
| Shareholding ratio | 32.1% | Consolidated |
| Number of shares held in own name treasury shares etc | 17,760,600 shares | Consolidated |
| Number of voting rights | 27,567,403 units | Consolidated |
| Carrying amount on the balance sheet | ¥1.0 billion | Consolidated |
| Carrying amount on the balance sheet | ¥113.6 billion | Consolidated |
| Book value equity securities not listed investment equity securities held for pure investment second largest holding company | ¥0.1 billion | Consolidated |
| Book value equity securities other than those not listed investment equity securities held for pure investment second largest holding company | ¥19.8 billion | Consolidated |
| Number of issues | 1 issues | Consolidated |
| Number of issues | 29 issues | Consolidated |
| Number of issues | 1 issues | Consolidated |
| Number of issues | 56 issues | Consolidated |
| Total shareholder return | 214.4% | Parent only |
Property and facilities (1 items)
| Item | Value | Consolidated / Non-consolidated |
|---|---|---|
| Capital expenditures | ¥543.0 billion | Consolidated |
Audit (11 items)
| Item | Value | Consolidated / Non-consolidated |
|---|---|---|
| Fees for audit and attestation services - reporting company | ¥0.2 billion | Consolidated |
| Fees for audit and attestation services - total | ¥0.5 billion | Consolidated |
| Fees for audit and attestation services - total | ¥2.7 billion | Consolidated |
| Fees for audit and attestation services - consolidated subsidiaries | ¥0.5 billion | Consolidated |
| Fees for audit and attestation services - consolidated subsidiaries | ¥2.6 billion | Consolidated |
| Fees for non-audit services - reporting company | ¥6.00 million | Consolidated |
| Fees for non-audit services - reporting company | ¥36.00 million | Consolidated |
| Fees for non-audit services - total | ¥0.1 billion | Consolidated |
| Fees for non-audit services - total | ¥80.00 million | Consolidated |
| Non audit fees consolidated subsidiaries network firms | ¥0.1 billion | Consolidated |
| Non audit fees consolidated subsidiaries | ¥44.00 million | Consolidated |
Balance sheet (136 items)
| Item | Value | Consolidated / Non-consolidated |
|---|---|---|
| Other | ¥48.5 billion | Consolidated |
| Other | ¥188.3 billion | Consolidated |
| Other | ¥797.7 billion | Consolidated |
| Other | ¥598.7 billion | Consolidated |
| Other | ¥47.1 billion | Consolidated |
| Valuation difference on available-for-sale securities | ¥1.6 billion | Consolidated |
| Other, net | ¥362.1 billion | Consolidated |
| Goodwill | ¥270.8 billion | Consolidated |
| Commercial papers | ¥5.9 billion | Consolidated |
| Call loan | ¥1.4 billion | Consolidated |
| Software | ¥215.4 billion | Consolidated |
| Reserve for loyalty awards credits | ¥8.0 billion | Consolidated |
| Lease obligations | ¥406.4 billion | Consolidated |
| Lease obligations | ¥75.3 billion | Consolidated |
| Lease assets | ¥25.8 billion | Consolidated |
| Lease assets, net | ¥126.7 billion | Consolidated |
| Reserve for contract of insurance | ¥97.00 million | Consolidated |
| Provision for contingent loss | ¥26.00 million | Consolidated |
| Provision for loss on interest repayment | ¥0.7 billion | Consolidated |
| Retained earnings | ¥474.0 billion | Consolidated |
| Raw materials and supplies | ¥14.2 billion | Consolidated |
| Notes and accounts receivable trade | ¥1,887.6 billion | Consolidated |
| Merchandise | ¥815.3 billion | Consolidated |
| Right of trademark | ¥37.1 billion | Consolidated |
| Operating loans | ¥663.9 billion | Consolidated |
| Non-current liabilities | ¥3,879.8 billion | Consolidated |
| Non-current assets | ¥5,692.0 billion | Consolidated |
| Land | ¥1,138.1 billion | Consolidated |
| Contract liabilities | ¥241.6 billion | Consolidated |
| Tools, furniture and fixtures | ¥319.7 billion | Consolidated |
| Guarantee deposits | ¥426.9 billion | Consolidated |
| Deposits for stores in preparation | ¥4.1 billion | Consolidated |
| Provision for loss on store closing | ¥17.3 billion | Consolidated |
| Buildings and structures, net | ¥1,880.9 billion | Consolidated |
| Construction in progress | ¥114.1 billion | Consolidated |
| Provision for directors' retirement benefits | ¥0.2 billion | Consolidated |
| Investments and other assets | ¥1,154.1 billion | Consolidated |
| Investment securities | ¥263.6 billion | Consolidated |
| Notes and accounts payable - trade | ¥1,476.0 billion | Consolidated |
| Subscription rights to shares | ¥1.8 billion | Consolidated |
| Securities | ¥1,289.1 billion | Consolidated |
| Property, plant and equipment | ¥3,941.6 billion | Consolidated |
| Income taxes payable | ¥71.7 billion | Consolidated |
| Shareholders' equity | ¥1,025.7 billion | Consolidated |
| Inventories | ¥829.5 billion | Consolidated |
| Inventories | ¥829.5 billion | Consolidated |
| Current liabilities | ¥9,285.5 billion | Consolidated |
| Current assets | ¥9,677.7 billion | Consolidated |
| Accumulated depreciation | ¥-3,889.8 billion | Consolidated |
| Foreign currency translation adjustment | ¥151.4 billion | Consolidated |
| Intangible assets | ¥596.3 billion | Consolidated |
| Cash and cash equivalents | ¥1,263.1 billion | Consolidated |
| Cash and deposits | ¥1,350.0 billion | Consolidated |
| Short-term loans payable | ¥370.9 billion | Consolidated |
| Bonds payable | ¥1,105.3 billion | Consolidated |
| Net assets | ¥2,204.3 billion | Consolidated |
| Net assets | ¥2,204.3 billion | Consolidated |
| Total assets | ¥15,369.7 billion | Consolidated |
| Total assets | ¥15,369.7 billion | Consolidated |
| Deferred gains or losses on hedges | ¥12.8 billion | Consolidated |
| Deferred tax liabilities | ¥27.2 billion | Consolidated |
| Deferred tax assets | ¥174.5 billion | Consolidated |
| Treasury stock | ¥-6.6 billion | Consolidated |
| Notes payable facilities | ¥56.0 billion | Consolidated |
| Valuation and translation adjustments | ¥192.7 billion | Consolidated |
| Liabilities | ¥13,165.4 billion | Consolidated |
| Liabilities and net assets | ¥15,369.7 billion | Consolidated |
| Allowance for doubtful accounts | ¥-4.1 billion | Consolidated |
| Allowance for doubtful accounts | ¥-139.9 billion | Consolidated |
| Capital surplus | ¥338.3 billion | Consolidated |
| Capital stock | ¥220.0 billion | Consolidated |
| Asset retirement obligations | ¥142.4 billion | Consolidated |
| Provision for bonuses | ¥50.8 billion | Consolidated |
| Remeasurements of defined benefit plans | ¥27.0 billion | Consolidated |
| Net defined benefit liability | ¥19.3 billion | Consolidated |
| Net defined benefit asset | ¥100.7 billion | Consolidated |
| Long-term loans payable | ¥1,845.2 billion | Consolidated |
| Long term guarantee deposited | ¥275.4 billion | Consolidated |
| Non-controlling interests | ¥984.1 billion | Consolidated |
| Current portion of bonds payable | ¥170.5 billion | Consolidated |
| Current portion of long-term loans payable | ¥469.8 billion | Consolidated |
| Other | ¥0.2 billion | Parent only |
| Other | ¥3.4 billion | Parent only |
| Other | ¥1.5 billion | Parent only |
| Other | ¥4.5 billion | Parent only |
| Other | ¥2.6 billion | Parent only |
| Valuation difference on available-for-sale securities | ¥30.4 billion | Parent only |
| Other capital surplus | ¥29.8 billion | Parent only |
| General reserve | ¥15.5 billion | Parent only |
| Retained earnings | ¥70.7 billion | Parent only |
| Legal retained earnings | ¥11.8 billion | Parent only |
| Right of trademark | ¥0.4 billion | Parent only |
| Non-current liabilities | ¥1,140.8 billion | Parent only |
| Non-current assets | ¥1,996.6 billion | Parent only |
| Reserve for advanced depreciation of noncurrent assets | ¥3.4 billion | Parent only |
| Land | ¥4.0 billion | Parent only |
| Tools, furniture and fixtures | ¥0.4 billion | Parent only |
| Buildings, net | ¥11.0 billion | Parent only |
| Investments and other assets | ¥1,978.1 billion | Parent only |
| Investment securities | ¥121.3 billion | Parent only |
| Subscription rights to shares | ¥0.7 billion | Parent only |
| Property, plant and equipment | ¥15.5 billion | Parent only |
| Accounts receivable - other | ¥7.3 billion | Parent only |
| Accrued income | ¥20.4 billion | Parent only |
| Income taxes payable | ¥0.4 billion | Parent only |
| Accrued consumption taxes | ¥0.7 billion | Parent only |
| Accrued expenses | ¥6.1 billion | Parent only |
| Accounts payable - other | ¥9.0 billion | Parent only |
| Shareholders' equity | ¥878.7 billion | Parent only |
| Structures, net | ¥79.00 million | Parent only |
| Current liabilities | ¥364.3 billion | Parent only |
| Current assets | ¥420.1 billion | Parent only |
| Intangible assets | ¥3.0 billion | Parent only |
| Cash and deposits | ¥18.9 billion | Parent only |
| Bonds payable | ¥440.0 billion | Parent only |
| Net assets | ¥911.7 billion | Parent only |
| Net assets | ¥911.7 billion | Parent only |
| Total assets | ¥2,416.7 billion | Parent only |
| Deferred gains or losses on hedges | ¥2.0 billion | Parent only |
| Deferred tax assets | ¥10.2 billion | Parent only |
| Retained earnings brought forward | ¥40.0 billion | Parent only |
| Treasury stock | ¥-5.9 billion | Parent only |
| Valuation and translation adjustments | ¥32.3 billion | Parent only |
| Liabilities | ¥1,505.0 billion | Parent only |
| Liabilities and net assets | ¥2,416.7 billion | Parent only |
| Allowance for doubtful accounts | ¥-61.00 million | Parent only |
| Capital surplus | ¥593.8 billion | Parent only |
| Legal capital surplus | ¥564.1 billion | Parent only |
| Capital stock | ¥220.0 billion | Parent only |
| Provision for bonuses | ¥0.4 billion | Parent only |
| Long-term loans payable | ¥589.9 billion | Parent only |
| Investments in capital of subsidiaries and affiliates | ¥72.8 billion | Parent only |
| Shares of subsidiaries and associates | ¥1,784.0 billion | Parent only |
| Loans receivable to subsidiaries and affiliates | ¥368.9 billion | Parent only |
| Deposits received | ¥310.9 billion | Parent only |
| Current portion of long-term loans payable | ¥35.3 billion | Parent only |
Accounts unique to this company (19 items)
| Item | Value | Consolidated / Non-consolidated |
|---|---|---|
| Revenue | ¥3,197.4 billion | Consolidated |
| Revenue | ¥5,474.1 billion | Consolidated |
| Revenue | ¥9.1 billion | Consolidated |
| Revenue | ¥486.2 billion | Consolidated |
| Revenue | ¥98.7 billion | Consolidated |
| Revenue | ¥1.9 billion | Consolidated |
| Revenue | ¥0.3 billion | Consolidated |
| Revenue | ¥7.0 billion | Consolidated |
| Revenue | ¥-174.6 billion | Consolidated |
| Revenue | ¥277.1 billion | Consolidated |
| Revenue | ¥-925.0 billion | Consolidated |
| Revenue | ¥398.9 billion | Consolidated |
| Revenue | ¥4,465.4 billion | Consolidated |
| Revenue | ¥19.6 billion | Consolidated |
| Revenue | ¥-13.4 billion | Parent only |
| Revenue | ¥110.7 billion | Parent only |
| Revenue | ¥23.1 billion | Parent only |
| Revenue | ¥0.2 billion | Parent only |
| Revenue | ¥1.1 billion | Parent only |
Statement of income (110 items)
| Item | Value | Consolidated / Non-consolidated |
|---|---|---|
| Other | ¥16.8 billion | Consolidated |
| Other | ¥13.6 billion | Consolidated |
| Other | ¥4.4 billion | Consolidated |
| Other | ¥3.2 billion | Consolidated |
| Other | ¥564.7 billion | Consolidated |
| Other comprehensive income | ¥52.8 billion | Consolidated |
| Other revenue form operatione | ¥873.7 billion | Consolidated |
| Valuation difference on available for sale securities net of tax | ¥-25.4 billion | Consolidated |
| Amortization of goodwill | ¥19.6 billion | Consolidated |
| Repair and maintenance | ¥226.8 billion | Consolidated |
| Dividends from surplus | ¥-35.7 billion | Consolidated |
| Comprehensive income | ¥177.3 billion | Consolidated |
| Interest income | ¥5.5 billion | Consolidated |
| Dividend income | ¥3.5 billion | Consolidated |
| Operating income | ¥270.5 billion | Consolidated |
| Operating income | ¥270.5 billion | Consolidated |
| Operating cost | ¥6,805.0 billion | Consolidated |
| Operating revenue | ¥10,715.3 billion | Consolidated |
| Operating revenue | ¥10,715.3 billion | Consolidated |
| Non-operating income | ¥37.6 billion | Consolidated |
| Non-operating expenses | ¥65.0 billion | Consolidated |
| Net cash provided by (used in) operating activities | ¥1,126.6 billion | Consolidated |
| Operating gross profit | ¥3,910.4 billion | Consolidated |
| Gain on sales of non-current assets | ¥1.3 billion | Consolidated |
| Loss on retirement of non-current assets | ¥4.7 billion | Consolidated |
| Rents | ¥464.2 billion | Consolidated |
| Cost of sales | ¥6,706.3 billion | Consolidated |
| Gross profit (loss) | ¥2,649.2 billion | Consolidated |
| Net sales | ¥9,355.4 billion | Consolidated |
| Advertising expenses | ¥137.6 billion | Consolidated |
| Loss on closing of stores | ¥3.2 billion | Consolidated |
| Provision for loss on store closing expenses | ¥9.6 billion | Consolidated |
| Net income | ¥72.7 billion | Consolidated |
| Net income | ¥72.7 billion | Consolidated |
| Net income (loss) | ¥124.5 billion | Consolidated |
| Net income (loss) | ¥124.5 billion | Consolidated |
| Employees' salaries and compensation | ¥1,290.2 billion | Consolidated |
| Gain on sales of investment securities | ¥1.2 billion | Consolidated |
| Net cash provided by (used in) investing activities | ¥-1,088.7 billion | Consolidated |
| Share of profit of investments accounted for using equity method | ¥9.1 billion | Consolidated |
| Share of other comprehensive income of investments accounted for using equity method | ¥0.1 billion | Consolidated |
| Interest expenses | ¥51.4 billion | Consolidated |
| Issuance of new shares | ¥247.2 billion | Consolidated |
| Gain on step acquisitions | ¥69.1 billion | Consolidated |
| Utilities expenses | ¥231.5 billion | Consolidated |
| Income taxes - current | ¥101.4 billion | Consolidated |
| Income taxes | ¥82.9 billion | Consolidated |
| Income taxes - deferred | ¥-18.5 billion | Consolidated |
| Legal and employee benefits expenses | ¥223.7 billion | Consolidated |
| Depreciation | ¥342.1 billion | Consolidated |
| Impairment loss | ¥97.5 billion | Consolidated |
| Impairment loss | ¥97.5 billion | Consolidated |
| Foreign currency translation adjustment net of tax | ¥40.8 billion | Consolidated |
| Extraordinary income | ¥91.9 billion | Consolidated |
| Extraordinary loss | ¥127.5 billion | Consolidated |
| Effect of exchange rate change on cash and cash equivalents | ¥13.0 billion | Consolidated |
| Net increase (decrease) in cash and cash equivalents | ¥91.0 billion | Consolidated |
| Income (loss) before income taxes | ¥207.5 billion | Consolidated |
| Income (loss) before income taxes | ¥207.5 billion | Consolidated |
| Ordinary income | ¥243.0 billion | Consolidated |
| Deferred gains or losses on hedges net of tax | ¥22.1 billion | Consolidated |
| Disposal of treasury stock | ¥26.9 billion | Consolidated |
| Purchase of treasury stock | ¥-0.8 billion | Consolidated |
| Comprehensive income attributable to owners of parent | ¥143.9 billion | Consolidated |
| Net cash provided by (used in) financing activities | ¥40.1 billion | Consolidated |
| Selling, general and administrative expenses | ¥3,639.9 billion | Consolidated |
| Reversal of allowance for doubtful accounts | ¥0.7 billion | Consolidated |
| Provision of allowance for doubtful accounts | ¥88.8 billion | Consolidated |
| Provision for bonuses | ¥50.8 billion | Consolidated |
| Remeasurements of defined benefit plans net of tax | ¥15.2 billion | Consolidated |
| Loss on sale of shares of subsidiaries and associates | ¥9.4 billion | Consolidated |
| Gain on sales of shares of subsidiaries and associates | ¥16.0 billion | Consolidated |
| Changes in equity of parent from transaction of non controlling interest | ¥-226.6 billion | Consolidated |
| Comprehensive income attributable to non-controlling interests | ¥33.4 billion | Consolidated |
| Net income (loss) attributable to non-controlling interests | ¥51.9 billion | Consolidated |
| Other | ¥0.6 billion | Parent only |
| Other | ¥2.8 billion | Parent only |
| Other | ¥1.0 billion | Parent only |
| Other | ¥41.00 million | Parent only |
| Dividends from surplus | ¥-35.7 billion | Parent only |
| Interest and dividend income | ¥11.5 billion | Parent only |
| Operating income | ¥62.0 billion | Parent only |
| Operating revenue | ¥91.1 billion | Parent only |
| Non-operating income | ¥12.2 billion | Parent only |
| Non-operating expenses | ¥42.1 billion | Parent only |
| Operating gross profit | ¥91.1 billion | Parent only |
| Advertising expenses | ¥1.8 billion | Parent only |
| Net income (loss) | ¥25.0 billion | Parent only |
| Net income (loss) | ¥25.0 billion | Parent only |
| Employees' salaries and compensation | ¥6.0 billion | Parent only |
| Gain on sales of investment securities | ¥99.00 million | Parent only |
| Loss on valuation of investment securities | ¥85.00 million | Parent only |
| Interest expenses | ¥16.1 billion | Parent only |
| Issuance of new shares | ¥247.2 billion | Parent only |
| Income taxes - current | ¥5.8 billion | Parent only |
| Income taxes | ¥14.2 billion | Parent only |
| Income taxes - deferred | ¥8.4 billion | Parent only |
| Depreciation | ¥1.2 billion | Parent only |
| Extraordinary income | ¥7.6 billion | Parent only |
| Extraordinary loss | ¥0.5 billion | Parent only |
| Income (loss) before income taxes | ¥39.2 billion | Parent only |
| Ordinary income | ¥32.1 billion | Parent only |
| Disposal of treasury stock | ¥26.9 billion | Parent only |
| Purchase of treasury stock | ¥-0.1 billion | Parent only |
| Investigation and research expenses | ¥6.0 billion | Parent only |
| Selling, general and administrative expenses | ¥29.1 billion | Parent only |
| Commissions from subsidiaries and affiliates | ¥33.4 billion | Parent only |
| Dividends from subsidiaries and associates | ¥56.7 billion | Parent only |
| Gain on sales of shares of subsidiaries and associates | ¥7.5 billion | Parent only |
| Loss on valuation of shares of subsidiaries and associates | ¥0.2 billion | Parent only |
Statement of changes in equity (4 items)
| Item | Value | Consolidated / Non-consolidated |
|---|---|---|
| Total changes during the period | ¥69.0 billion | Consolidated |
| Net changes in items other than shareholders' equity | ¥-14.9 billion | Consolidated |
| Total changes during the period | ¥275.8 billion | Parent only |
| Net changes in items other than shareholders' equity | ¥12.6 billion | Parent only |
Statement of cash flows (55 items)
| Item | Value | Consolidated / Non-consolidated |
|---|---|---|
| Other | ¥43.2 billion | Consolidated |
| Other | ¥-77.0 billion | Consolidated |
| Other | ¥-9.0 billion | Consolidated |
| Increase decrease in other assets liabilities | ¥173.4 billion | Consolidated |
| Amortization of goodwill | ¥19.6 billion | Consolidated |
| Repayments of lease obligations | ¥-82.8 billion | Consolidated |
| Increase decrease in notes and accounts payable trade | ¥216.4 billion | Consolidated |
| Interest expenses paid | ¥-48.3 billion | Consolidated |
| Interest and dividends income received | ¥13.6 billion | Consolidated |
| Increase (decrease) in provision for loss on interest repayment | ¥-0.5 billion | Consolidated |
| Interest and dividend income | ¥-9.0 billion | Consolidated |
| Decrease increase in operating loans receivable | ¥4.1 billion | Consolidated |
| Purchase of non-current assets | ¥-528.5 billion | Consolidated |
| Proceeds from sales of non-current assets | ¥6.1 billion | Consolidated |
| Gain on sales of non-current assets | ¥-1.3 billion | Consolidated |
| Decrease increase in notes and accounts receivable trade | ¥107.6 billion | Consolidated |
| Subtotal | ¥1,263.6 billion | Consolidated |
| Proceeds from collection of guarantee deposits | ¥40.2 billion | Consolidated |
| Payments for guarantee deposits | ¥-10.3 billion | Consolidated |
| Purchase of investment securities | ¥-5.0 billion | Consolidated |
| Proceeds from sales of investment securities | ¥14.1 billion | Consolidated |
| Equity in earnings losses of affiliates | ¥-9.1 billion | Consolidated |
| Interest expenses | ¥51.4 billion | Consolidated |
| Purchase of short term investment securities | ¥-7.7 billion | Consolidated |
| Proceeds from sales and redemption of marketable securities | ¥17.6 billion | Consolidated |
| Loss gain on sales of short term and long term investment securities | ¥-1.2 billion | Consolidated |
| Decrease (increase) in inventories | ¥-19.3 billion | Consolidated |
| Loss gain on step acquisitions | ¥-69.1 billion | Consolidated |
| Income taxes paid | ¥-102.3 billion | Consolidated |
| Depreciation | ¥362.9 billion | Consolidated |
| Impairment loss | ¥97.5 billion | Consolidated |
| Foreign exchange loss (gain) | ¥2.5 billion | Consolidated |
| Increase (decrease) in short-term borrowings and commercial paper | ¥-70.9 billion | Consolidated |
| Redemption of bonds | ¥-191.9 billion | Consolidated |
| Proceeds from issuance of bonds | ¥309.0 billion | Consolidated |
| Regarding purchase of treasury stock | ¥-0.1 billion | Consolidated |
| Increase (decrease) in allowance for doubtful accounts | ¥-6.2 billion | Consolidated |
| Increase (decrease) in provision for bonuses | ¥-0.8 billion | Consolidated |
| Increase (decrease) in net defined benefit liability | ¥0.1 billion | Consolidated |
| Inorease (decrease) in asset for retirement benefits | ¥-9.1 billion | Consolidated |
| Proceeds from purchase of shares of subsidiaries resulting in change in scope of consolidation | ¥13.6 billion | Consolidated |
| Payments for acquisition in subsidiaries resulting in change in scope of consolidation | ¥-1.2 billion | Consolidated |
| Proceeds from sales of shares of subsidiaries resulting in change in scope of consolidation | ¥7.00 million | Consolidated |
| Payments for sale of shares of subsidiaries resulting in change in scope of consolidation | ¥-26.8 billion | Consolidated |
| Payments from changes in ownership interests in subsidiaries that do not result in change in scope of consolidation | ¥-106.8 billion | Consolidated |
| Proceeds from changes in ownership interests in subsidiaries that do not result in change in scope of consolidation | ¥4.4 billion | Consolidated |
| Dividends | ¥-35.7 billion | Consolidated |
| Proceeds from long term loans payable | ¥783.2 billion | Consolidated |
| Repayment of long term loans payable | ¥-458.1 billion | Consolidated |
| Loss (gain) on sale of shares of subsidiaries and associates | ¥-6.6 billion | Consolidated |
| Proceeds from share issuance to non controlling shareholders | ¥3.4 billion | Consolidated |
| Repayments to non-controlling shareholders | ¥-80.1 billion | Consolidated |
| Dividends paid to non-controlling interests | ¥-24.6 billion | Consolidated |
| Proceeds from guarantee deposits received | ¥23.9 billion | Consolidated |
| Repayments of guarantee deposits received | ¥-21.7 billion | Consolidated |
Basic indicators
| Item | Value | Consolidated / Non-consolidated | Source |
|---|---|---|---|
| Net cash provided by (used in) operating activities | ¥1,126.6 billion | Consolidated | Disclosed |
| Dividend per share | 14 | Parent only | Disclosed |
| Number of employees | 179,230 | Consolidated | Disclosed |
| Net assets | ¥2,204.3 billion | Consolidated | Disclosed |
| Net sales | ¥9,355.4 billion | Consolidated | Disclosed |
| Operating income | ¥270.5 billion | Consolidated | Disclosed |
| Operating revenue | ¥10,715.3 billion | Consolidated | Disclosed |
| Ordinary income | ¥243.0 billion | Consolidated | Disclosed |
| Net income | ¥72.7 billion | Consolidated | Disclosed |
| Total assets | ¥15,369.7 billion | Consolidated | Disclosed |
| Operating margin | 2.5% | Consolidated | Calculated |
| Net margin | 0.7% | Consolidated | Calculated |
| Sales per employee | 59785427 yen | Consolidated | Calculated |
| Total asset turnover | 0.7 times | Consolidated | Calculated |
| Net assets to total assets | 14.3% | Consolidated | Calculated |