HPC SYSTEMS
HPC SYSTEMS Inc.
Company highlights
The largest segment by revenue is HPC business, at 63.2% of the total.
Key figures
Period Jul 2025 to Jun 2026ConsolidatedJapanese GAAP
Company profile
Tables scroll sideways
Disclosed data
Business activities and revenue composition
HPC SYSTEMS
Revenue and profit by business segment
Period Jul 2025 to Jun 2026Source Annual securities reportsConsolidated・Disclosed
| Business | Net sales to external customers | Operating income | |||||
|---|---|---|---|---|---|---|---|
| This year | Share | Last year | This year | Share | Margin | Last year | |
| HPC business | ¥5.0 billion | 63.2% | ¥4.6 billion | ¥0.5 billion | 65.5% | 9.3% | ¥0.5 billion |
| CTO business | ¥2.9 billion | 36.8% | ¥2.5 billion | ¥0.2 billion | 34.5% | 8.5% | ¥0.2 billion |
| Total of the businesses | ¥7.9 billion | 100.0% | ¥0.7 billion | 100.0% | |||
Revenue and profit
HPC SYSTEMS
Period Jul 2025 to Jun 2026Source Annual securities reports
Amounts by account
| Group | Account | Amount | Consolidated / Non-consolidated |
|---|---|---|---|
| Selling, general and administrative expenses | Salaries and allowances | ¥0.6 billion | Consolidated |
| Directors' compensations | ¥0.1 billion | Consolidated | |
| Provision for bonuses | ¥95.11 million | Consolidated | |
| Depreciation | ¥50.17 million | Consolidated | |
| Research and development expenses | ¥28.36 million | Consolidated | |
| Provision for directors' bonuses | ¥12.28 million | Consolidated | |
| Provision for product warranties | ¥8.09 million | Consolidated | |
| Profit by stage | Gross profit (loss) | ¥2.3 billion | Consolidated |
| Operating income | ¥0.7 billion | Consolidated | |
| Ordinary income | ¥0.7 billion | Consolidated | |
| Net income | ¥0.5 billion | Consolidated |
HPC SYSTEMS
Selling, general and administrative expenses
Period Jul 2025 to Jun 2026Source Annual securities reports
- Salaries and allowances ¥0.6 billion
- Directors' compensations ¥0.1 billion
- Provision for bonuses ¥0.1 billion
- Depreciation ¥0.1 billion
- Research and development expenses ¥0.0 billion
- Provision for directors' bonuses ¥0.0 billion
- Other (not itemized) ¥0.7 billion
Performance, financial position and capital allocation
Long-term changes in performance
HPC SYSTEMS
Long-term revenue, profit and asset trends
Period 2016 to 2026Source Annual securities reportsDisclosed
HPC SYSTEMS
Recent performance trends
Source Annual securities reports
Year-on-year comparison
| Item | 2022 | 2023 | 2024 | 2025 | 2026 |
|---|---|---|---|---|---|
| Net sales | ¥6.0B | ¥8.9B | ¥6.9B | ¥7.1B | ¥7.9B |
| Year on year (%) | +3.3% | +47.0%◆ | comparison basis not confirmed | +1.7% | +11.9% |
| Ordinary income (loss) | ¥0.6B | ¥0.3B | ¥0.4B | ¥0.6B | ¥0.7B |
| Change from prior year | -5.3% | -56.3% | comparison basis not confirmed | +51.2% | +6.4% |
| Ordinary income (loss) as a share of Net sales | 10.5% | 3.1% | 6.1% | 9.1% | 8.7% |
| Change (percentage points) | -1.0 points | -7.4 points◆ | comparison basis not confirmed | +3.0 points◆ | -0.4 points |
Fiscal periods marked for changes
Earlier fiscal periods (3)
- 2017Net sales year on year +34.7%, Ordinary income (loss) as a share of revenue +3.9 points
- 2019Net sales year on year +33.1%
- 2020Ordinary income (loss) as a share of revenue +3.0 points
- 2021Net sales year on year +23.3%
- 2023Net sales year on year +47.0%, Ordinary income (loss) as a share of revenue -7.4 points
- 2025Ordinary income (loss) as a share of revenue +3.0 points
HPC SYSTEMS
Earnings and net assets per share over time
Unit yenSource Annual securities reports
HPC SYSTEMS
Return on equity over time
Unit %Source Annual securities reports
Consolidated indicators (15 items)
| Item | 4 years ago | 3 years ago | 2 years ago | Last year | This year |
|---|---|---|---|---|---|
| Net sales | Could not be retrieved | Could not be retrieved | ¥6.9 billion | ¥7.1 billion | ¥7.9 billion |
| Ordinary income (loss) | Could not be retrieved | Could not be retrieved | ¥0.4 billion | ¥0.6 billion | ¥0.7 billion |
| Net income (loss) attributable to owners of parent | Could not be retrieved | Could not be retrieved | ¥0.3 billion | ¥0.4 billion | ¥0.5 billion |
| Comprehensive income | Could not be retrieved | Could not be retrieved | ¥0.3 billion | ¥0.4 billion | ¥0.5 billion |
| Net assets | Could not be retrieved | Could not be retrieved | ¥2.5 billion | ¥2.6 billion | ¥2.4 billion |
| Total assets | Could not be retrieved | Could not be retrieved | ¥4.8 billion | ¥4.5 billion | ¥11.4 billion |
| Net assets per share | Could not be retrieved | Could not be retrieved | 579.3 yen | 627.56 yen | 624.3 yen |
| Basic earnings (loss) per share | Could not be retrieved | Could not be retrieved | 69.66 yen | 101.59 yen | 119.57 yen |
| Diluted earnings per share | Could not be retrieved | Could not be retrieved | 69.09 yen | 100.89 yen | 119.3 yen |
| Equity-to-asset ratio | Could not be retrieved | Could not be retrieved | 52.2% | 57.5% | 21.1% |
| Return on equity | Could not be retrieved | Could not be retrieved | 12.5% | 16.7% | 18.2% |
| Net cash provided by (used in) operating activities | Could not be retrieved | Could not be retrieved | ¥4.1 billion | ¥1.3 billion | ¥-7.8 billion |
| Net cash provided by (used in) investing activities | Could not be retrieved | Could not be retrieved | ¥-8.66 million | ¥-55.20 million | ¥20.99 million |
| Net cash provided by (used in) financing activities | Could not be retrieved | Could not be retrieved | ¥-3.4 billion | ¥-1.0 billion | ¥6.5 billion |
| Cash and cash equivalents | Could not be retrieved | Could not be retrieved | ¥1.7 billion | ¥2.0 billion | ¥0.7 billion |
Parent only indicators (18 items)
| Item | 4 years ago | 3 years ago | 2 years ago | Last year | This year |
|---|---|---|---|---|---|
| Net sales | ¥6.0 billion | ¥8.9 billion | ¥6.9 billion | ¥7.1 billion | ¥7.9 billion |
| Ordinary income (loss) | ¥0.6 billion | ¥0.3 billion | ¥0.4 billion | ¥0.7 billion | ¥0.7 billion |
| Net income (loss) | ¥0.4 billion | ¥0.2 billion | ¥0.3 billion | ¥0.5 billion | ¥0.4 billion |
| Capital stock | ¥0.2 billion | ¥0.2 billion | ¥0.2 billion | ¥0.2 billion | ¥0.2 billion |
| Total number of issued shares (common stock) | 4,302,000 shares | 4,358,000 shares | 4,360,500 shares | 4,367,000 shares | 4,375,500 shares |
| Net assets | ¥2.2 billion | ¥2.3 billion | ¥2.5 billion | ¥2.6 billion | ¥2.4 billion |
| Total assets | ¥4.6 billion | ¥7.9 billion | ¥4.7 billion | ¥4.5 billion | ¥11.4 billion |
| Net assets per share | 523.81 yen | 537.1 yen | 572.34 yen | 628.3 yen | 621 yen |
| Dividend per share | 25 yen | 25 yen | 25 yen | 28 yen | 32 yen |
| Basic earnings (loss) per share | 102.92 yen | 42.93 yen | 60.47 yen | 109.21 yen | 115.72 yen |
| Diluted earnings per share | 100.07 yen | 42.42 yen | 59.98 yen | 108.46 yen | 115.46 yen |
| Equity-to-asset ratio | 48.6% | 29.3% | 52.0% | 57.7% | 21.1% |
| Return on equity | 21.9% | 8.1% | 10.9% | 18.0% | 17.6% |
| Payout ratio | 24.3% | 58.2% | 41.3% | 25.6% | 27.7% |
| Net cash provided by (used in) operating activities | ¥-1.2 billion | ¥-2.8 billion | Could not be retrieved | Could not be retrieved | Could not be retrieved |
| Net cash provided by (used in) investing activities | ¥-0.1 billion | ¥-0.2 billion | Could not be retrieved | Could not be retrieved | Could not be retrieved |
| Net cash provided by (used in) financing activities | ¥0.8 billion | ¥2.8 billion | Could not be retrieved | Could not be retrieved | Could not be retrieved |
| Cash and cash equivalents | ¥1.3 billion | ¥1.0 billion | Could not be retrieved | Could not be retrieved | Could not be retrieved |
Dividend history
| Fiscal year | Annual dividend per share | Of which interim | Payout ratio (as reported, parent only) | Flag |
|---|---|---|---|---|
| FY ending 6/2026 | ¥32 | Could not be retrieved | 27.7% | |
| FY ending 6/2025 | ¥28 | Could not be retrieved | 25.6% | |
| FY ending 6/2024 | ¥25 | Could not be retrieved | 41.3% | |
| FY ending 6/2023 | ¥25 | Could not be retrieved | 58.2% | |
| FY ending 6/2022 | ¥25 | Could not be retrieved | 24.3% |
HPC SYSTEMS
Dividends per share over time
Unit yenSource Annual securities reports
Shareholder composition
Share ownership by holder category
HPC SYSTEMS
Unit %Source Annual securities reports
- Financial institutions10.88%
- Securities firms6.59%
- Other corporations18.22%
- Foreign holders (institutions)14.01%
- Foreign holders (individuals)0.50%
- Individuals and others49.80%
Major shareholders
| Rank | Shareholder | Shareholding ratio | Shares held |
|---|---|---|---|
| 1 | FUBON SECURITIES CO.,LTD. CLIENT 30(常任代理人 シティバンク、エヌ・エイ東京支店) | 10.39% | 428,700 |
| 2 | 株式会社日本カストディ銀行(信託口) | 9.15% | 377,500 |
| 3 | リョーサン菱洋株式会社 | 7.38% | 304,800 |
| 4 | ナラサキ産業株式会社 | 6.76% | 279,000 |
| 5 | アズワン株式会社 | 3.53% | 145,800 |
| 6 | BNY GCM CLIENT ACCOUNT JPRD AC ISG(FE-AC)(常任代理人 株式会社三菱UFJ銀行) | 2.45% | 100,978 |
| 7 | 小野 鉄平 | 2.42% | 100,000 |
| 8 | 楽天証券株式会社共有口 | 1.88% | 77,400 |
| 9 | 野村證券株式会社 | 1.47% | 60,516 |
| 10 | 日本証券金融株式会社 | 1.36% | 56,200 |
Research and development expenses and capital expenditure
| Fiscal year | Research and development | Capital expenditure |
|---|---|---|
| FY ending 6/2026 | ¥28.36 million | ¥61.43 million |
| FY ending 6/2025 | ¥36.34 million | ¥47.72 million |
| FY ending 6/2020 | ¥11.48 million | ¥51.44 million |
Research and development expenses and capital expenditure by segment (FY ending 6/2026)
| Segment | Research and development |
|---|---|
| HPC business | ¥14.33 million |
| CTO business | ¥14.03 million |
Revenue scale in the same industry
HPC SYSTEMS
Source Annual securities reports of each company
Information and Communication: 642 companies · revenue · largest first・each company’s latest fiscal year・Consolidated・Disclosed
- 1 NTTFY Mar 2026 ¥14.4T
- 2 SoftBank GroupFY Mar 2026 ¥7.8T
- 3 ソフトバンクFY Mar 2026 ¥7.0T
- … 292 companies
- 296 パワーソリューションズFY Dec 2025 ¥8.1B
- 297 情報戦略テクノロジーFY Dec 2025 ¥8.0B
- 298 HPC SYSTEMSThis companyFY Jun 2026 ¥7.9B
- 299 フーディソンFY Mar 2026 ¥7.8B
- 300 MonstarlabFY Dec 2025 ¥7.8B
- … 342 companies
Workforce information
Audit and disclosure information
| Item | Value |
|---|---|
| Audit firm | 太陽有限責任監査法人 |
| Audit fees (this year, total) | ¥24.00 million |
| Non-audit fees (this year, total) | Not applicable |
| Going concern note | Cannot be determined |
| Accounting standard | Japanese GAAP |
Related books, articles and videos
Books that cover companies in the same industry
This company: not covered in the books below
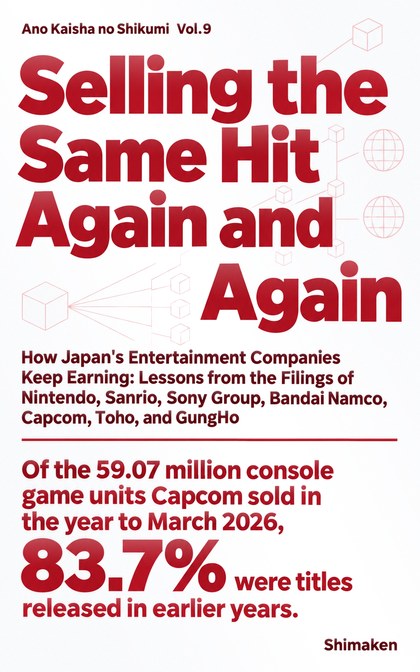 Same industry: Information and Communication
“Kaisha no Shikumi: Selling the Same Hit Again and Again”
Reads the filings of game and film companies for how many years and in how many ways they resell the same title.
Information and Communication companies in this book: CAPCOM, TOHO, GungHo Online Entertainment
“Ano Kaisha no Shikumi” series, Vol.9 — Kindle and paperback
Find it on Amazon →
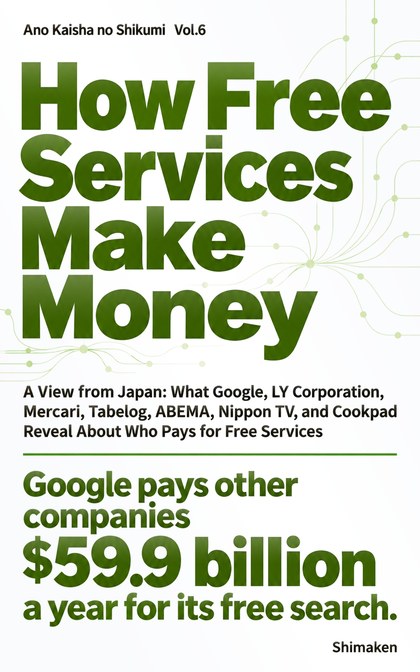 Same industry: Information and Communication
“Kaisha no Shikumi: Free”
Reads the filings of internet and broadcasting companies for who pays for services that users get free.
Information and Communication companies in this book: LY, Mercari, Nippon Television
“Ano Kaisha no Shikumi” series, Vol.6 — Kindle and paperback
Find it on Amazon →
Sources and methodology
Retrieved disclosed figures
Major management indicators (5 years) (29 items)
| Item | Value | Consolidated / Non-consolidated |
|---|---|---|
| Comprehensive income | ¥0.5 billion | Consolidated |
| Net cash provided by (used in) operating activities | ¥-7.8 billion | Consolidated |
| Net sales | ¥7.9 billion | Consolidated |
| Net cash provided by (used in) investing activities | ¥20.99 million | Consolidated |
| Diluted earnings per share | 119.3 yen | Consolidated |
| Cash and cash equivalents | ¥0.7 billion | Consolidated |
| Net assets | ¥2.4 billion | Consolidated |
| Ordinary income (loss) | ¥0.7 billion | Consolidated |
| Total assets | ¥11.4 billion | Consolidated |
| Return on equity | 18.2% | Consolidated |
| Equity-to-asset ratio | 21.1% | Consolidated |
| Net income (loss) attributable to owners of parent | ¥0.5 billion | Consolidated |
| Net cash provided by (used in) financing activities | ¥6.5 billion | Consolidated |
| Basic earnings (loss) per share | 119.57 yen | Consolidated |
| Net assets per share | 624.3 yen | Consolidated |
| Dividend per share | 32 yen | Parent only |
| Net sales | ¥7.9 billion | Parent only |
| Net income (loss) | ¥0.4 billion | Parent only |
| Diluted earnings per share | 115.46 yen | Parent only |
| Total number of issued shares (common stock) | 4,375,500 shares | Parent only |
| Net assets | ¥2.4 billion | Parent only |
| Ordinary income (loss) | ¥0.7 billion | Parent only |
| Total assets | ¥11.4 billion | Parent only |
| Return on equity | 17.6% | Parent only |
| Equity-to-asset ratio | 21.1% | Parent only |
| Capital stock | ¥0.2 billion | Parent only |
| Payout ratio | 27.7% | Parent only |
| Basic earnings (loss) per share | 115.72 yen | Parent only |
| Net assets per share | 621 yen | Parent only |
Employees (10 items)
| Item | Value | Consolidated / Non-consolidated |
|---|---|---|
| Number of employees | 137 people | Consolidated |
| Number of employees | 137 people | Consolidated |
| Wage gap between men and women (all employees) | 69.9% | Parent only |
| Average length of service (years) | 9 years | Parent only |
| Average annual salary | ¥6.61 million | Parent only |
| Average age (years) | 45.4 years old | Parent only |
| Number of employees | 134 people | Parent only |
| Number of employees | 134 people | Parent only |
| Number of employees | 134 people | Parent only |
| Wage gap between men and women (regular employees) | 69.9% | Parent only |
Other disclosed items (13 items)
| Item | Value | Consolidated / Non-consolidated |
|---|---|---|
| Net sales to external customers | ¥7.9 billion | Consolidated |
| Average number of temporary employees | 7 people | Consolidated |
| Average number of temporary employees | 7 people | Consolidated |
| Increase in property plant and equipment and intangible assets | ¥61.43 million | Consolidated |
| Write-downs of inventories | ¥0.1 billion | Consolidated |
| Depreciation | ¥58.43 million | Consolidated |
| Number of consolidated subsidiaries | 1 companies | Consolidated |
| Rate of male employees taking childcare leave (all employees) | 100.0% | Parent only |
| Average number of temporary employees | 7 people | Parent only |
| Average number of temporary employees | 7 people | Parent only |
| Average number of temporary employees | 7 people | Parent only |
| Total return on the share price index | 232.1% | Parent only |
| Ratio of female employees in managerial positions | 8.3% | Parent only |
Shares (10 items)
| Item | Value | Consolidated / Non-consolidated |
|---|---|---|
| Number of shares held | 1,930,894 shares | Consolidated |
| Total number of shares held treasury shares etc | 248,100 shares | Consolidated |
| Number of shares | 4,375,500 shares | Consolidated |
| Shareholding ratio treasury shares etc | 5.7% | Consolidated |
| Shareholding ratio | 46.8% | Consolidated |
| Number of shares held in own name treasury shares etc | 248,100 shares | Consolidated |
| Number of voting rights | 41,066 units | Consolidated |
| Book value equity securities not listed investment equity securities held for pure investment reporting company | ¥11.03 million | Consolidated |
| Number of issues | 1 issues | Consolidated |
| Total shareholder return | 109.4% | Parent only |
Research and development (1 items)
| Item | Value | Consolidated / Non-consolidated |
|---|---|---|
| Research and development expenses | ¥28.36 million | Consolidated |
Property and facilities (1 items)
| Item | Value | Consolidated / Non-consolidated |
|---|---|---|
| Capital expenditures | ¥61.43 million | Consolidated |
Audit (2 items)
| Item | Value | Consolidated / Non-consolidated |
|---|---|---|
| Fees for audit and attestation services - reporting company | ¥24.00 million | Consolidated |
| Fees for audit and attestation services - total | ¥24.00 million | Consolidated |
Accounts unique to this company (15 items)
| Item | Value | Consolidated / Non-consolidated |
|---|---|---|
| Revenue | ¥-40.16 million | Consolidated |
| Revenue | ¥5.7 billion | Consolidated |
| Revenue | ¥12.97 million | Consolidated |
| Revenue | ¥1.05 million | Consolidated |
| Revenue | ¥-0.5 billion | Consolidated |
| Revenue | ¥40.16 million | Consolidated |
| Revenue | ¥12.97 million | Consolidated |
| Revenue | ¥12.97 million | Consolidated |
| Change in average annual salary from the previous year | 14.4% | Parent only |
| Revenue | ¥5.7 billion | Parent only |
| Revenue | ¥12.97 million | Parent only |
| Revenue | ¥55.66 million | Parent only |
| Revenue | ¥1.05 million | Parent only |
| Revenue | ¥-0.5 billion | Parent only |
| Revenue | ¥12.97 million | Parent only |
Balance sheet (105 items)
| Item | Value | Consolidated / Non-consolidated |
|---|---|---|
| Other | ¥29.86 million | Consolidated |
| Other | ¥0.1 billion | Consolidated |
| Other | ¥0.2 billion | Consolidated |
| Software | ¥25.89 million | Consolidated |
| Work in process | ¥1.0 billion | Consolidated |
| Retained earnings | ¥2.7 billion | Consolidated |
| Advances received | ¥0.5 billion | Consolidated |
| Advance payments trade | ¥0.4 billion | Consolidated |
| Raw materials and supplies | ¥2.2 billion | Consolidated |
| Non-current liabilities | ¥0.1 billion | Consolidated |
| Non-current assets | ¥0.3 billion | Consolidated |
| Land | ¥14.70 million | Consolidated |
| Accounts receivable - trade | ¥0.8 billion | Consolidated |
| Accounts receivable - trade | ¥0.8 billion | Consolidated |
| Tools, furniture and fixtures | ¥12.05 million | Consolidated |
| Buildings, net | ¥58.73 million | Consolidated |
| Provision for directors' bonuses | ¥12.28 million | Consolidated |
| Investments and other assets | ¥0.2 billion | Consolidated |
| Investment securities | ¥11.03 million | Consolidated |
| Notes and accounts payable - trade | ¥0.3 billion | Consolidated |
| Property, plant and equipment | ¥0.1 billion | Consolidated |
| Income taxes payable | ¥0.2 billion | Consolidated |
| Shareholders' equity | ¥2.4 billion | Consolidated |
| Provision for stocks payment-NCL | ¥21.58 million | Consolidated |
| Machinery and equipment, net | ¥33.97 million | Consolidated |
| Current liabilities | ¥8.9 billion | Consolidated |
| Current assets | ¥11.1 billion | Consolidated |
| Accumulated depreciation | ¥-0.5 billion | Consolidated |
| Foreign currency translation adjustment | ¥2.49 million | Consolidated |
| Intangible assets | ¥25.89 million | Consolidated |
| Cash and cash equivalents | ¥0.7 billion | Consolidated |
| Cash and deposits | ¥0.8 billion | Consolidated |
| Short-term loans payable | ¥7.5 billion | Consolidated |
| Net assets | ¥2.4 billion | Consolidated |
| Net assets | ¥2.4 billion | Consolidated |
| Total assets | ¥11.4 billion | Consolidated |
| Total assets | ¥11.4 billion | Consolidated |
| Deferred tax assets | ¥0.1 billion | Consolidated |
| Treasury stock | ¥-0.9 billion | Consolidated |
| Finished goods | ¥30.16 million | Consolidated |
| Provision for product warranties | ¥58.69 million | Consolidated |
| Valuation and translation adjustments | ¥2.49 million | Consolidated |
| Liabilities | ¥9.0 billion | Consolidated |
| Liabilities and net assets | ¥11.4 billion | Consolidated |
| Capital surplus | ¥0.4 billion | Consolidated |
| Capital stock | ¥0.2 billion | Consolidated |
| Provision for bonuses | ¥0.1 billion | Consolidated |
| Vehicles, net | ¥0.20 million | Consolidated |
| Long-term loans payable | ¥0.1 billion | Consolidated |
| Electronically recorded monetary claims - operating | ¥3.76 million | Consolidated |
| Current portion of long-term loans payable | ¥0.2 billion | Consolidated |
| Other | ¥29.37 million | Parent only |
| Other | ¥0.1 billion | Parent only |
| Other capital surplus | ¥0.1 billion | Parent only |
| Software | ¥25.89 million | Parent only |
| Work in process | ¥1.0 billion | Parent only |
| Investments in capital | ¥0.01 million | Parent only |
| Retained earnings | ¥2.7 billion | Parent only |
| Advances received | ¥0.5 billion | Parent only |
| Prepaid expenses | ¥60.71 million | Parent only |
| Advance payments trade | ¥0.4 billion | Parent only |
| Raw materials and supplies | ¥2.2 billion | Parent only |
| Non-current liabilities | ¥0.1 billion | Parent only |
| Non-current assets | ¥0.4 billion | Parent only |
| Land | ¥14.70 million | Parent only |
| Accounts receivable - trade | ¥0.8 billion | Parent only |
| Tools, furniture and fixtures | ¥11.69 million | Parent only |
| Buildings | ¥58.73 million | Parent only |
| Provision for directors' bonuses | ¥12.28 million | Parent only |
| Investments and other assets | ¥0.2 billion | Parent only |
| Investment securities | ¥11.03 million | Parent only |
| Property, plant and equipment | ¥0.1 billion | Parent only |
| Income taxes payable | ¥0.2 billion | Parent only |
| Accrued expenses | ¥37.82 million | Parent only |
| Accounts payable - other | ¥66.72 million | Parent only |
| Shareholders' equity | ¥2.4 billion | Parent only |
| Provision for stocks payment-NCL | ¥21.58 million | Parent only |
| Machinery and equipment | ¥33.97 million | Parent only |
| Current liabilities | ¥8.9 billion | Parent only |
| Current assets | ¥11.1 billion | Parent only |
| Intangible assets | ¥25.89 million | Parent only |
| Cash and deposits | ¥0.8 billion | Parent only |
| Short-term loans payable | ¥7.5 billion | Parent only |
| Net assets | ¥2.4 billion | Parent only |
| Net assets | ¥2.4 billion | Parent only |
| Total assets | ¥11.4 billion | Parent only |
| Deferred tax assets | ¥0.1 billion | Parent only |
| Retained earnings brought forward | ¥2.7 billion | Parent only |
| Treasury stock | ¥-0.9 billion | Parent only |
| Finished goods | ¥30.16 million | Parent only |
| Provision for product warranties | ¥58.69 million | Parent only |
| Liabilities | ¥9.0 billion | Parent only |
| Liabilities and net assets | ¥11.4 billion | Parent only |
| Accounts payable - trade | ¥0.3 billion | Parent only |
| Capital surplus | ¥0.4 billion | Parent only |
| Legal capital surplus | ¥0.2 billion | Parent only |
| Capital stock | ¥0.2 billion | Parent only |
| Provision for bonuses | ¥0.1 billion | Parent only |
| Vehicle and delivery equipment | ¥0.20 million | Parent only |
| Long-term loans payable | ¥0.1 billion | Parent only |
| Long-term prepaid expenses | ¥0.11 million | Parent only |
| Shares of subsidiaries and associates | ¥21.54 million | Parent only |
| Electronically recorded monetary claims - operating | ¥3.76 million | Parent only |
| Deposits received | ¥9.42 million | Parent only |
| Current portion of long-term loans payable | ¥0.2 billion | Parent only |
Statement of income (82 items)
| Item | Value | Consolidated / Non-consolidated |
|---|---|---|
| Other | ¥1.35 million | Consolidated |
| Other | ¥0.31 million | Consolidated |
| Other comprehensive income | ¥1.22 million | Consolidated |
| Dividend income of insurance | ¥0.27 million | Consolidated |
| Dividends from surplus | ¥-0.1 billion | Consolidated |
| Comprehensive income | ¥0.5 billion | Consolidated |
| Interest income | ¥7.51 million | Consolidated |
| Operating income | ¥0.7 billion | Consolidated |
| Operating income | ¥0.7 billion | Consolidated |
| Non-operating income | ¥69.11 million | Consolidated |
| Non-operating expenses | ¥97.00 million | Consolidated |
| Net cash provided by (used in) operating activities | ¥-7.8 billion | Consolidated |
| Loss on retirement of non-current assets | ¥0.06 million | Consolidated |
| Cost of sales | ¥5.6 billion | Consolidated |
| Gross profit (loss) | ¥2.3 billion | Consolidated |
| Net sales | ¥7.9 billion | Consolidated |
| Net sales | ¥7.9 billion | Consolidated |
| Net income | ¥0.5 billion | Consolidated |
| Net income | ¥0.5 billion | Consolidated |
| Net income (loss) | ¥0.5 billion | Consolidated |
| Net income (loss) | ¥0.5 billion | Consolidated |
| Directors' compensations | ¥0.1 billion | Consolidated |
| Provision for directors' bonuses | ¥12.28 million | Consolidated |
| Loss on valuation of investment securities | ¥40.16 million | Consolidated |
| Net cash provided by (used in) investing activities | ¥20.99 million | Consolidated |
| Interest expenses | ¥16.49 million | Consolidated |
| Commission fees | ¥80.19 million | Consolidated |
| Issuance of new shares | ¥1.68 million | Consolidated |
| Income taxes - current | ¥0.2 billion | Consolidated |
| Income taxes | ¥0.2 billion | Consolidated |
| Income taxes - deferred | ¥-20.68 million | Consolidated |
| Depreciation | ¥50.17 million | Consolidated |
| Foreign exchange gains | ¥58.92 million | Consolidated |
| Foreign currency translation adjustment net of tax | ¥1.22 million | Consolidated |
| Extraordinary loss | ¥40.23 million | Consolidated |
| Effect of exchange rate change on cash and cash equivalents | ¥8.02 million | Consolidated |
| Net increase (decrease) in cash and cash equivalents | ¥-1.2 billion | Consolidated |
| Research and development expenses | ¥28.36 million | Consolidated |
| Income (loss) before income taxes | ¥0.6 billion | Consolidated |
| Income (loss) before income taxes | ¥0.6 billion | Consolidated |
| Ordinary income | ¥0.7 billion | Consolidated |
| Salaries and allowances | ¥0.6 billion | Consolidated |
| Disposal of treasury stock | ¥0.5 billion | Consolidated |
| Purchase of treasury stock | ¥-0.5 billion | Consolidated |
| Provision for product warranties | ¥8.09 million | Consolidated |
| Comprehensive income attributable to owners of parent | ¥0.5 billion | Consolidated |
| Net cash provided by (used in) financing activities | ¥6.5 billion | Consolidated |
| Selling, general and administrative expenses | ¥1.6 billion | Consolidated |
| Provision for bonuses | ¥95.11 million | Consolidated |
| Other | ¥1.33 million | Parent only |
| Other | ¥0.29 million | Parent only |
| Dividend income of insurance | ¥0.27 million | Parent only |
| Dividends from surplus | ¥-0.1 billion | Parent only |
| Interest income | ¥7.51 million | Parent only |
| Operating income | ¥0.7 billion | Parent only |
| Non-operating income | ¥69.00 million | Parent only |
| Non-operating expenses | ¥96.97 million | Parent only |
| Loss on retirement of non-current assets | ¥0.06 million | Parent only |
| Cost of sales | ¥5.6 billion | Parent only |
| Gross profit (loss) | ¥2.3 billion | Parent only |
| Net sales | ¥7.9 billion | Parent only |
| Net income (loss) | ¥0.4 billion | Parent only |
| Net income (loss) | ¥0.4 billion | Parent only |
| Provision for directors' bonuses | ¥12.28 million | Parent only |
| Loss on valuation of investment securities | ¥40.16 million | Parent only |
| Interest expenses | ¥16.49 million | Parent only |
| Commission fees | ¥80.19 million | Parent only |
| Issuance of new shares | ¥1.68 million | Parent only |
| Income taxes - current | ¥0.2 billion | Parent only |
| Income taxes | ¥0.2 billion | Parent only |
| Income taxes - deferred | ¥-20.68 million | Parent only |
| Depreciation | ¥50.10 million | Parent only |
| Foreign exchange gains | ¥58.85 million | Parent only |
| Extraordinary loss | ¥40.23 million | Parent only |
| Income (loss) before income taxes | ¥0.6 billion | Parent only |
| Ordinary income | ¥0.7 billion | Parent only |
| Salaries and allowances | ¥0.6 billion | Parent only |
| Disposal of treasury stock | ¥0.5 billion | Parent only |
| Purchase of treasury stock | ¥-0.5 billion | Parent only |
| Provision for product warranties | ¥8.09 million | Parent only |
| Selling, general and administrative expenses | ¥1.6 billion | Parent only |
| Provision for bonuses | ¥95.11 million | Parent only |
Statement of changes in equity (3 items)
| Item | Value | Consolidated / Non-consolidated |
|---|---|---|
| Total changes during the period | ¥-0.2 billion | Consolidated |
| Net changes in items other than shareholders' equity | ¥1.22 million | Consolidated |
| Total changes during the period | ¥-0.2 billion | Parent only |
Statement of cash flows (29 items)
| Item | Value | Consolidated / Non-consolidated |
|---|---|---|
| Other | ¥27.38 million | Consolidated |
| Other | ¥-0.02 million | Consolidated |
| Other | ¥-86.20 million | Consolidated |
| Increase decrease in notes and accounts payable trade | ¥-0.2 billion | Consolidated |
| Interest expenses paid | ¥-25.48 million | Consolidated |
| Interest and dividends income received | ¥7.51 million | Consolidated |
| Decrease (increase) in advance payments to suppliers | ¥-0.4 billion | Consolidated |
| Interest and dividend income | ¥-7.51 million | Consolidated |
| Loss on retirement of non-current assets | ¥0.06 million | Consolidated |
| Decrease increase in notes and accounts receivable trade | ¥0.4 billion | Consolidated |
| Net decrease (increase) in time deposits | ¥88.87 million | Consolidated |
| Subtotal | ¥-7.5 billion | Consolidated |
| Increase decrease in provision for directors bonuses | ¥-3.47 million | Consolidated |
| Interest expenses | ¥16.49 million | Consolidated |
| Proceeds from exercise of share acquisition rights | ¥1.68 million | Consolidated |
| Purchase of property plant and equipment | ¥-47.63 million | Consolidated |
| Increase (decrease) in provision for share awards | ¥21.58 million | Consolidated |
| Decrease (increase) in inventories | ¥-8.2 billion | Consolidated |
| Income taxes paid | ¥-0.2 billion | Consolidated |
| Depreciation | ¥58.43 million | Consolidated |
| Foreign exchange loss (gain) | ¥-30.88 million | Consolidated |
| Purchase of intangible assets | ¥-20.23 million | Consolidated |
| Increase in short term loans payable | ¥8.3 billion | Consolidated |
| Decrease in short term loans payable | ¥-0.8 billion | Consolidated |
| Regarding purchase of treasury stock | ¥-0.5 billion | Consolidated |
| Increase (decrease) in provisions for product warranties | ¥8.09 million | Consolidated |
| Increase (decrease) in provision for bonuses | ¥-22.78 million | Consolidated |
| Dividends | ¥-0.1 billion | Consolidated |
| Repayment of long term loans payable | ¥-0.2 billion | Consolidated |
Basic indicators
| Item | Value | Consolidated / Non-consolidated | Source |
|---|---|---|---|
| Net cash provided by (used in) operating activities | ¥-7.8 billion | Consolidated | Disclosed |
| Dividend per share | 32 | Parent only | Disclosed |
| Number of employees | 137 | Consolidated | Disclosed |
| Net assets | ¥2.4 billion | Consolidated | Disclosed |
| Net sales | ¥7.9 billion | Consolidated | Disclosed |
| Operating income | ¥0.7 billion | Consolidated | Disclosed |
| Ordinary income | ¥0.7 billion | Consolidated | Disclosed |
| Net income | ¥0.5 billion | Consolidated | Disclosed |
| Total assets | ¥11.4 billion | Consolidated | Disclosed |
| Operating margin | 9.0% | Consolidated | Calculated |
| Net margin | 5.8% | Consolidated | Calculated |
| Sales per employee | 57710993 yen | Consolidated | Calculated |
| Total asset turnover | 0.69 times | Consolidated | Calculated |
| Net assets to total assets | 21.1% | Consolidated | Calculated |