ICHIKOH INDUSTRIES
ICHIKOH INDUSTRIES, LTD.
Company highlights
The annual dividend per share has risen for 5 consecutive years.
Key figures
Period Jan 2025 to Dec 2025ConsolidatedJapanese GAAP
Company profile
Tables scroll sideways
Disclosed data
Business activities and revenue composition
Breakdown by business: not published
Revenue and profit
ICHIKOH INDUSTRIES
Period Jan 2025 to Dec 2025Source Annual securities reports
Amounts by account
| Group | Account | Amount | Consolidated / Non-consolidated |
|---|---|---|---|
| Selling, general and administrative expenses | Research and development expenses | ¥5.6 billion | Consolidated |
| Freightage expenses | ¥2.1 billion | Consolidated | |
| Salaries | ¥1.6 billion | Consolidated | |
| Provision for bonuses | ¥0.5 billion | Consolidated | |
| Retirement benefit expenses | ¥0.3 billion | Consolidated | |
| Depreciation | ¥0.2 billion | Parent only | |
| Provision for product warranties | ¥9.00 million | Parent only | |
| Profit by stage | Gross profit (loss) | ¥20.9 billion | Consolidated |
| Ordinary income | ¥7.6 billion | Consolidated | |
| Net income | ¥6.2 billion | Consolidated | |
| Operating income | ¥5.8 billion | Consolidated |
ICHIKOH INDUSTRIES
Selling, general and administrative expenses
Period Jan 2025 to Dec 2025Source Annual securities reports
- Research and development expenses ¥5.6 billion
- Freightage expenses ¥2.1 billion
- Salaries ¥1.6 billion
- Provision for bonuses ¥0.5 billion
- Retirement benefit expenses ¥0.3 billion
- Depreciation ¥0.2 billion
- Other (not itemized) ¥4.9 billion
Performance, financial position and capital allocation
Long-term changes in performance
ICHIKOH INDUSTRIES
Long-term revenue, profit and asset trends
Period 2013 to 2025Source Annual securities reportsDisclosed
ICHIKOH INDUSTRIES
Recent performance trends
Source Annual securities reports
Year-on-year comparison
| Item | 2021 | 2022 | 2023 | 2024 | 2025 |
|---|---|---|---|---|---|
| Net sales | ¥125.5B | ¥135.5B | ¥145.9B | ¥125.5B | ¥117.1B |
| Year on year (%) | +10.2% | +7.9% | +7.7% | -14.0% | -6.7% |
| Ordinary income (loss) | ¥6.5B | ¥5.4B | ¥8.1B | ¥6.5B | ¥7.6B |
| Change from prior year | +28.9% | -17.8% | +51.9% | -19.8% | +16.1% |
| Ordinary income (loss) as a share of Net sales | 5.2% | 4.0% | 5.6% | 5.2% | 6.5% |
| Change (percentage points) | +0.8 points | -1.2 points | +1.6 points | -0.4 points | +1.3 points |
Fiscal periods marked for changes
- 2015Ordinary income (loss) as a share of revenue +2.1 points
- 2018Net sales year on year +49.5%
ICHIKOH INDUSTRIES
Earnings and net assets per share over time
Unit yenSource Annual securities reports
ICHIKOH INDUSTRIES
Return on equity over time
Unit %Source Annual securities reports
Consolidated indicators (14 items)
| Item | 4 years ago | 3 years ago | 2 years ago | Last year | This year |
|---|---|---|---|---|---|
| Net sales | ¥125.5 billion | ¥135.5 billion | ¥145.9 billion | ¥125.5 billion | ¥117.1 billion |
| Ordinary income (loss) | ¥6.5 billion | ¥5.4 billion | ¥8.1 billion | ¥6.5 billion | ¥7.6 billion |
| Net income (loss) attributable to owners of parent | ¥4.0 billion | ¥4.4 billion | ¥7.8 billion | ¥4.5 billion | ¥6.2 billion |
| Comprehensive income | ¥6.1 billion | ¥5.4 billion | ¥10.7 billion | ¥7.4 billion | ¥10.6 billion |
| Net assets | ¥49.5 billion | ¥55.0 billion | ¥64.7 billion | ¥71.0 billion | ¥80.1 billion |
| Total assets | ¥112.5 billion | ¥125.9 billion | ¥129.4 billion | ¥130.1 billion | ¥129.6 billion |
| Net assets per share | 508.97 yen | 565.32 yen | 666 yen | 728.29 yen | 821.9 yen |
| Basic earnings (loss) per share | 41.44 yen | 46.02 yen | 81.53 yen | 46.48 yen | 64.47 yen |
| Equity-to-asset ratio | 43.5% | 43.1% | 49.5% | 53.8% | 61.0% |
| Return on equity | 8.6% | 8.6% | 13.2% | 6.7% | 8.3% |
| Net cash provided by (used in) operating activities | ¥9.2 billion | ¥13.0 billion | ¥13.4 billion | ¥11.0 billion | ¥12.0 billion |
| Net cash provided by (used in) investing activities | ¥-6.7 billion | ¥-5.9 billion | ¥-9.6 billion | ¥-4.7 billion | ¥-10.8 billion |
| Net cash provided by (used in) financing activities | ¥-2.4 billion | ¥-4.4 billion | ¥-3.8 billion | ¥-3.0 billion | ¥-2.1 billion |
| Cash and cash equivalents | ¥5.7 billion | ¥8.6 billion | ¥8.9 billion | ¥12.6 billion | ¥12.4 billion |
Parent only indicators (14 items)
| Item | 4 years ago | 3 years ago | 2 years ago | Last year | This year |
|---|---|---|---|---|---|
| Net sales | ¥94.5 billion | ¥94.3 billion | ¥101.9 billion | ¥87.0 billion | ¥82.8 billion |
| Ordinary income (loss) | ¥3.7 billion | ¥3.1 billion | ¥4.1 billion | ¥2.9 billion | ¥9.0 billion |
| Net income (loss) | ¥2.8 billion | ¥2.0 billion | ¥4.1 billion | ¥3.4 billion | ¥7.9 billion |
| Capital stock | ¥9.0 billion | ¥9.0 billion | ¥9.0 billion | ¥9.0 billion | ¥9.0 billion |
| Total number of issued shares (common stock) | 96,292,000 shares | 96,292,000 shares | 96,334,000 shares | 96,363,000 shares | 96,431,000 shares |
| Net assets | ¥40.2 billion | ¥42.5 billion | ¥45.6 billion | ¥47.9 billion | ¥54.5 billion |
| Total assets | ¥86.7 billion | ¥92.2 billion | ¥92.3 billion | ¥90.4 billion | ¥91.2 billion |
| Net assets per share | 418.17 yen | 442.14 yen | 474.52 yen | 498.17 yen | 566.63 yen |
| Dividend per share | 7 yen | 9 yen | 11 yen | 13 yen | 14 yen |
| Interim dividend per share | 3.5 yen | 4.5 yen | 5.5 yen | 6.5 yen | 7 yen |
| Basic earnings (loss) per share | 29.64 yen | 21.23 yen | 42.36 yen | 35.65 yen | 82.05 yen |
| Equity-to-asset ratio | 46.3% | 46.1% | 49.4% | 53.0% | 59.8% |
| Return on equity | 7.3% | 4.9% | 9.2% | 7.3% | 15.4% |
| Payout ratio | 23.6% | 42.4% | 26.0% | 36.5% | 17.1% |
Dividend history
| Fiscal year | Annual dividend per share | Of which interim | Payout ratio (as reported, parent only) | Flag |
|---|---|---|---|---|
| FY ending 12/2025 | ¥14 | ¥7 | 17.1% | |
| FY ending 12/2024 | ¥13 | ¥6.5 | 36.5% | |
| FY ending 12/2023 | ¥11 | ¥5.5 | 26.0% | |
| FY ending 12/2022 | ¥9 | ¥4.5 | 42.4% | |
| FY ending 12/2021 | ¥7 | ¥3.5 | 23.6% | |
| FY ending 12/2020 | ¥3.5 | ¥1 | 10.5% | |
| FY ending 12/2019 | ¥7 | ¥3.5 | 19.1% | |
| FY ending 12/2018 | ¥7 | ¥2.5 | 8.1% | |
| FY ending 12/2017 | ¥4 | ¥2.5 | 13.1% | Fiscal year was not 12 months, Fiscal year was not 12 months |
| FY ending 3/2016 | ¥3 | ¥1.5 | 10.8% | |
| FY ending 3/2015 | ¥3 | ¥1.5 | 11.8% | |
| FY ending 3/2014 | ¥1.5 | Could not be retrieved | Could not be retrieved |
ICHIKOH INDUSTRIES
Dividends per share over time
Unit yenSource Annual securities reports
Shareholder composition
Share ownership by holder category
ICHIKOH INDUSTRIES
Unit %Source Annual securities reports
- Financial institutions9.90%
- Securities firms1.39%
- Other corporations1.11%
- Foreign holders (institutions)79.36%
- Foreign holders (individuals)0.05%
- Individuals and others8.19%
Major shareholders
| Rank | Shareholder | Shareholding ratio | Shares held |
|---|---|---|---|
| 1 | ヴァレオ・マネジメント (常任代理人 ㈱三菱UFJ銀行、みずほ証券㈱) | 61.08% | 58,791,000 |
| 2 | 日本マスタートラスト信託銀行㈱(信託口) | 5.19% | 5,000,000 |
| 3 | BNP PARIBAS MADRID / 2S / JASDEC / SPANISH RESIDENTS / UCITS ASSETS(常任代理人 香港上海銀行東京支店 セキュリティーズ・サービシズ・オペレーションズ) | 4.5% | 4,334,000 |
| 4 | 日本カストディ銀行㈱(信託口) | 2.98% | 2,868,000 |
| 5 | GOLDMAN SACHS INTERNATIONAL(常任代理人 ゴールドマン・サックス㈱) | 1.43% | 1,383,000 |
| 6 | 日本生命保険(相)(常任代理人 日本マスタートラスト信託銀行㈱) | 1.02% | 988,000 |
| 7 | BNY GCM CLIRNT ACCOUNT JPRD AC ISG(FE-AC)(常任代理人 ㈱三菱UFJ銀行) | 0.89% | 861,000 |
| 8 | BNP PARIBAS | 0.82% | 791,000 |
| 9 | NOMURA PB NOMINEES LIMITED OMNIBUS-MARGIN (CASHPB)(常任代理人 野村證券㈱) | 0.8% | 771,000 |
| 10 | MLI FOR CLIENT GENERAL OMNI NON COLLATERAL NON TREATY-PB(常任代理人 BOFA証券㈱) | 0.74% | 715,000 |
Research and development expenses and capital expenditure
| Fiscal year | Research and development | Capital expenditure |
|---|---|---|
| FY ending 12/2025 | ¥5.6 billion | ¥3.2 billion |
| FY ending 12/2024 | ¥5.8 billion | Could not be retrieved |
| FY ending 12/2020 | ¥7.2 billion | ¥8.5 billion |
| FY ending 12/2019 | ¥8.0 billion | Could not be retrieved |
| FY ending 3/2017 | ¥6.5 billion | Could not be retrieved |
| FY ending 3/2016 | ¥6.5 billion | Could not be retrieved |
Revenue scale in the same industry
ICHIKOH INDUSTRIES
Source Annual securities reports of each company
Electric Appliances: 239 companies · revenue · largest first・each company’s latest fiscal year・Consolidated・Disclosed
- 1 SONY GROUPFY Mar 2026 ¥12.5T
- 2 HitachiFY Mar 2026 ¥10.6T
- 3 PanasonicFY Mar 2026 ¥8.0T
- … 75 companies
- 79 TAMURAFY Mar 2026 ¥123.6B
- 80 ANRITSUFY Mar 2026 ¥117.5B
- 81 ICHIKOH INDUSTRIESThis companyFY Dec 2025 ¥117.1B
- 82 Nippon SignalFY Mar 2026 ¥114.1B
- 83 Shindengen Electric ManufacturingFY Mar 2026 ¥113.8B
- … 156 companies
Workforce information
Women 12.9 yrs Average length of service by gender
Women 481 Employees by gender
Administrative filings and published information
Workplace information filings
| Item | Value |
|---|---|
| Employees | 3,870 |
| Average monthly overtime (statutory overtime plus work on statutory days off) |
10.1 hours |
| Annual paid leave taken |
83.2% |
| Childcare leave taken, men |
64% |
| Childcare leave taken, women |
80% |
| Share of managers who are women | 4.5% |
| Share of board members who are women | 10% |
Greenhouse gas emissions
| Category | Emissions |
|---|---|
| 特定事業所排出者 | 42,355 t-CO2 |
| Sites covered by the report | 3 |
Audit and disclosure information
| Item | Value |
|---|---|
| Audit firm | EY新日本有限責任監査法人 |
| Audit fees (this year, total) | ¥75.00 million |
| Non-audit fees (this year, total) | Not applicable |
| Audit fees (this year, network firms) | ¥19.00 million |
| Going concern note | Cannot be determined |
| Accounting standard | Japanese GAAP |
Related books, articles and videos
Books that cover companies in the same industry
This company: not covered in this book
 Same industry: Electric Appliances
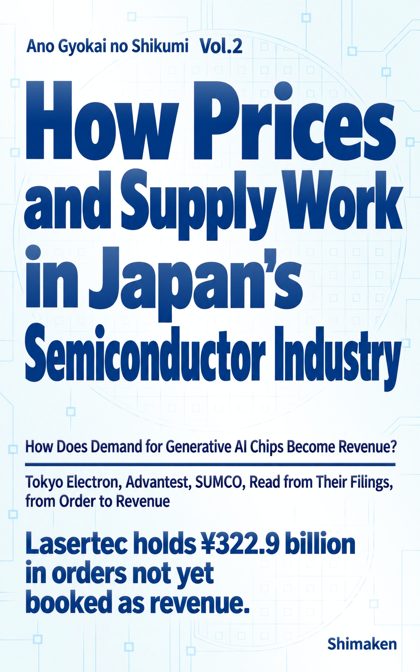
“How Prices and Supply Work in Japan's Semiconductor Industry”
Reads the filings of makers of chips and of chip-making and testing equipment for the time lag from order to sales and cash, and for how prices and supply are set.
Electric Appliances companies in this book: Tokyo Electron, ADVANTEST, Lasertec and others (5 in all)
“Ano Gyokai no Shikumi” series, Vol.2 — Kindle and paperback
Find it on Amazon →
Sources and methodology
Retrieved disclosed figures
Major management indicators (5 years) (28 items)
| Item | Value | Consolidated / Non-consolidated |
|---|---|---|
| Comprehensive income | ¥10.6 billion | Consolidated |
| Net cash provided by (used in) operating activities | ¥12.0 billion | Consolidated |
| Net sales | ¥117.1 billion | Consolidated |
| Net cash provided by (used in) investing activities | ¥-10.8 billion | Consolidated |
| Cash and cash equivalents | ¥12.4 billion | Consolidated |
| Net assets | ¥80.1 billion | Consolidated |
| Ordinary income (loss) | ¥7.6 billion | Consolidated |
| Total assets | ¥129.6 billion | Consolidated |
| Return on equity | 8.3% | Consolidated |
| Equity-to-asset ratio | 61.0% | Consolidated |
| Net income (loss) attributable to owners of parent | ¥6.2 billion | Consolidated |
| Net cash provided by (used in) financing activities | ¥-2.1 billion | Consolidated |
| Basic earnings (loss) per share | 64.47 yen | Consolidated |
| Net assets per share | 821.9 yen | Consolidated |
| Dividend per share | 14 yen | Parent only |
| Net sales | ¥82.8 billion | Parent only |
| Net income (loss) | ¥7.9 billion | Parent only |
| Total number of issued shares (common stock) | 96,431,000 shares | Parent only |
| Net assets | ¥54.5 billion | Parent only |
| Ordinary income (loss) | ¥9.0 billion | Parent only |
| Total assets | ¥91.2 billion | Parent only |
| Return on equity | 15.4% | Parent only |
| Equity-to-asset ratio | 59.8% | Parent only |
| Capital stock | ¥9.0 billion | Parent only |
| Payout ratio | 17.1% | Parent only |
| Interim dividend per share | 7 yen | Parent only |
| Basic earnings (loss) per share | 82.05 yen | Parent only |
| Net assets per share | 566.63 yen | Parent only |
Employees (11 items)
| Item | Value | Consolidated / Non-consolidated |
|---|---|---|
| Number of employees | 2,693 people | Consolidated |
| Wage gap between men and women (all employees) | 58.7% | Parent only |
| Average length of service (years) | 17 years | Parent only |
| Average length of service months | 10 months | Parent only |
| Average annual salary | ¥6.49 million | Parent only |
| Average age (years) | 41 years old | Parent only |
| Average age months | 6 months | Parent only |
| Number of employees | 1,359 people | Parent only |
| Number of employees | 1,359 people | Parent only |
| Wage gap between men and women (regular employees) | 72.4% | Parent only |
| Wage gap between men and women (non-regular employees) | 62.8% | Parent only |
Other disclosed items (9 items)
| Item | Value | Consolidated / Non-consolidated |
|---|---|---|
| Average number of temporary employees | 1,107 people | Consolidated |
| Number of associates accounted for using equity method | 2 companies | Consolidated |
| Write-downs of inventories | ¥0.9 billion | Consolidated |
| Number of consolidated subsidiaries | 4 companies | Consolidated |
| Rate of male employees taking childcare leave (all employees) | 63.6% | Parent only |
| Average number of temporary employees | 595 people | Parent only |
| Average number of temporary employees | 595 people | Parent only |
| Total return on the share price index | 333.1% | Parent only |
| Ratio of female employees in managerial positions | 4.5% | Parent only |
Shares (13 items)
| Item | Value | Consolidated / Non-consolidated |
|---|---|---|
| Total of dividends received equity securities not listed investment equity securities held for pure investment reporting company | ¥0 | Consolidated |
| Number of shares held | 76,507,000 shares | Consolidated |
| Total number of shares held treasury shares etc | 181,900 shares | Consolidated |
| Number of shares | 96,431,141 shares | Consolidated |
| Shareholding ratio treasury shares etc | 0.2% | Consolidated |
| Shareholding ratio | 79.5% | Consolidated |
| Number of shares held in own name treasury shares etc | 181,900 shares | Consolidated |
| Number of voting rights | 961,984 units | Consolidated |
| Carrying amount on the balance sheet | ¥40.00 million | Consolidated |
| Book value equity securities not listed investment equity securities held for pure investment reporting company | ¥5.00 million | Consolidated |
| Number of issues | 3 issues | Consolidated |
| Number of issues | 2 issues | Consolidated |
| Total shareholder return | 76.4% | Parent only |
Research and development (2 items)
| Item | Value | Consolidated / Non-consolidated |
|---|---|---|
| Research and development expenses included in general and administrative expenses and manufacturing cost for current period | ¥5.6 billion | Consolidated |
| Research and development expenses | ¥5.6 billion | Consolidated |
Property and facilities (1 items)
| Item | Value | Consolidated / Non-consolidated |
|---|---|---|
| Capital expenditures | ¥3.2 billion | Consolidated |
Audit (4 items)
| Item | Value | Consolidated / Non-consolidated |
|---|---|---|
| Fees for audit and attestation services - reporting company | ¥75.00 million | Consolidated |
| Fees for audit and attestation services - total | ¥19.00 million | Consolidated |
| Fees for audit and attestation services - total | ¥75.00 million | Consolidated |
| Fees for audit and attestation services - consolidated subsidiaries | ¥19.00 million | Consolidated |
Balance sheet (133 items)
| Item | Value | Consolidated / Non-consolidated |
|---|---|---|
| Other | ¥0.1 billion | Consolidated |
| Other | ¥1.1 billion | Consolidated |
| Other | ¥2.7 billion | Consolidated |
| Other | ¥2.6 billion | Consolidated |
| Other | ¥41.00 million | Consolidated |
| Lease obligations | ¥4.8 billion | Consolidated |
| Lease obligations | ¥0.7 billion | Consolidated |
| Lease assets | ¥10.3 billion | Consolidated |
| Lease assets, net | ¥5.1 billion | Consolidated |
| Work in process | ¥3.0 billion | Consolidated |
| Retained earnings | ¥59.8 billion | Consolidated |
| Raw materials and supplies | ¥3.9 billion | Consolidated |
| Merchandise and finished goods | ¥1.6 billion | Consolidated |
| Non-current liabilities | ¥10.7 billion | Consolidated |
| Non-current assets | ¥60.2 billion | Consolidated |
| Land | ¥1.8 billion | Consolidated |
| Accounts receivable - trade | ¥12.6 billion | Consolidated |
| Accounts receivable - trade | ¥12.6 billion | Consolidated |
| Tools, furniture and fixtures | ¥12.7 billion | Consolidated |
| Tools, furniture and fixtures | ¥1.6 billion | Consolidated |
| Buildings and structures | ¥26.4 billion | Consolidated |
| Buildings and structures, net | ¥12.2 billion | Consolidated |
| Construction in progress | ¥1.7 billion | Consolidated |
| Provision for directors' bonuses | ¥5.00 million | Consolidated |
| Investments and other assets | ¥22.4 billion | Consolidated |
| Investment securities | ¥4.4 billion | Consolidated |
| Property, plant and equipment | ¥37.8 billion | Consolidated |
| Income taxes payable | ¥0.6 billion | Consolidated |
| Accrued expenses | ¥4.9 billion | Consolidated |
| Accounts payable - other | ¥2.5 billion | Consolidated |
| Shareholders' equity | ¥71.3 billion | Consolidated |
| Machinery, equipment and vehicles | ¥43.5 billion | Consolidated |
| Machinery, equipment and vehicles, net | ¥15.4 billion | Consolidated |
| Current liabilities | ¥38.8 billion | Consolidated |
| Current assets | ¥69.4 billion | Consolidated |
| Accumulated depreciation | ¥-5.3 billion | Consolidated |
| Accumulated depreciation | ¥-11.1 billion | Consolidated |
| Accumulated depreciation | ¥-14.1 billion | Consolidated |
| Accumulated depreciation | ¥-28.1 billion | Consolidated |
| Foreign currency translation adjustment | ¥6.0 billion | Consolidated |
| Intangible assets | ¥41.00 million | Consolidated |
| Cash and cash equivalents | ¥12.4 billion | Consolidated |
| Cash and deposits | ¥12.4 billion | Consolidated |
| Short-term loans receivable with resale agreement | ¥33.2 billion | Consolidated |
| Net assets | ¥80.1 billion | Consolidated |
| Net assets | ¥80.1 billion | Consolidated |
| Total assets | ¥129.6 billion | Consolidated |
| Deferred tax assets | ¥3.5 billion | Consolidated |
| Treasury stock | ¥-56.00 million | Consolidated |
| Provision for product warranties | ¥0.4 billion | Consolidated |
| Valuation and translation adjustments | ¥7.9 billion | Consolidated |
| Liabilities | ¥49.5 billion | Consolidated |
| Liabilities and net assets | ¥129.6 billion | Consolidated |
| Accounts payable - trade | ¥13.5 billion | Consolidated |
| Allowance for doubtful accounts | ¥-2.00 million | Consolidated |
| Allowance for doubtful accounts | ¥-66.00 million | Consolidated |
| Capital surplus | ¥2.5 billion | Consolidated |
| Capital stock | ¥9.0 billion | Consolidated |
| Asset retirement obligations | ¥26.00 million | Consolidated |
| Provision for bonuses | ¥0.6 billion | Consolidated |
| Remeasurements of defined benefit plans | ¥1.9 billion | Consolidated |
| Net defined benefit liability | ¥5.7 billion | Consolidated |
| Net defined benefit asset | ¥5.1 billion | Consolidated |
| Long-term loans receivable | ¥0.9 billion | Consolidated |
| Investments in capital of subsidiaries and affiliates | ¥7.5 billion | Consolidated |
| Electronically recorded obligations - operating | ¥12.7 billion | Consolidated |
| Electronically recorded monetary claims - operating | ¥0.1 billion | Consolidated |
| Non-controlling interests | ¥1.0 billion | Consolidated |
| Other | ¥0.9 billion | Parent only |
| Other | ¥1.8 billion | Parent only |
| Other | ¥0.1 billion | Parent only |
| Software | ¥16.00 million | Parent only |
| Lease obligations | ¥3.1 billion | Parent only |
| Lease obligations | ¥0.4 billion | Parent only |
| Lease assets, net | ¥3.3 billion | Parent only |
| Work in process | ¥2.7 billion | Parent only |
| Leasehold right | ¥3.00 million | Parent only |
| Retained earnings | ¥43.2 billion | Parent only |
| Prepaid pension cost | ¥2.8 billion | Parent only |
| Prepaid expenses | ¥0.2 billion | Parent only |
| Raw materials and supplies | ¥1.9 billion | Parent only |
| Merchandise and finished goods | ¥1.1 billion | Parent only |
| Non-current liabilities | ¥8.4 billion | Parent only |
| Non-current assets | ¥41.1 billion | Parent only |
| Land | ¥1.3 billion | Parent only |
| Accounts receivable - trade | ¥10.2 billion | Parent only |
| Tools, furniture and fixtures | ¥1.3 billion | Parent only |
| Buildings, net | ¥9.3 billion | Parent only |
| Construction in progress | ¥1.4 billion | Parent only |
| Provision for directors' bonuses | ¥5.00 million | Parent only |
| Investments and other assets | ¥15.1 billion | Parent only |
| Investment securities | ¥45.00 million | Parent only |
| Right of using facilities | ¥21.00 million | Parent only |
| Property, plant and equipment | ¥25.9 billion | Parent only |
| Accounts receivable - other | ¥1.5 billion | Parent only |
| Income taxes payable | ¥0.1 billion | Parent only |
| Accrued expenses | ¥2.5 billion | Parent only |
| Accounts payable - other | ¥2.3 billion | Parent only |
| Shareholders' equity | ¥54.5 billion | Parent only |
| Structures, net | ¥0.3 billion | Parent only |
| Machinery and equipment, net | ¥8.9 billion | Parent only |
| Current liabilities | ¥28.3 billion | Parent only |
| Current assets | ¥50.1 billion | Parent only |
| Intangible assets | ¥41.00 million | Parent only |
| Cash and deposits | ¥3.8 billion | Parent only |
| Short-term loans payable | ¥0.8 billion | Parent only |
| Short-term loans receivable with resale agreement | ¥28.4 billion | Parent only |
| Net assets | ¥54.5 billion | Parent only |
| Net assets | ¥54.5 billion | Parent only |
| Total assets | ¥91.2 billion | Parent only |
| Deferred tax assets | ¥3.5 billion | Parent only |
| Retained earnings brought forward | ¥43.2 billion | Parent only |
| Treasury stock | ¥-56.00 million | Parent only |
| Provision for product warranties | ¥0.2 billion | Parent only |
| Liabilities | ¥36.7 billion | Parent only |
| Liabilities and net assets | ¥91.2 billion | Parent only |
| Accounts payable - trade | ¥8.6 billion | Parent only |
| Allowance for doubtful accounts | ¥-2.00 million | Parent only |
| Allowance for doubtful accounts | ¥-83.00 million | Parent only |
| Capital surplus | ¥2.3 billion | Parent only |
| Legal capital surplus | ¥2.3 billion | Parent only |
| Capital stock | ¥9.0 billion | Parent only |
| Asset retirement obligations | ¥26.00 million | Parent only |
| Provision for bonuses | ¥19.00 million | Parent only |
| Vehicles, net | ¥58.00 million | Parent only |
| Provision for retirement benefits | ¥5.3 billion | Parent only |
| Long-term prepaid expenses | ¥0.2 billion | Parent only |
| Long-term loans receivable | ¥0.9 billion | Parent only |
| Investments in capital of subsidiaries and affiliates | ¥2.2 billion | Parent only |
| Shares of subsidiaries and associates | ¥4.5 billion | Parent only |
| Electronically recorded obligations - operating | ¥10.7 billion | Parent only |
| Electronically recorded monetary claims - operating | ¥0.1 billion | Parent only |
| Deposits received | ¥0.8 billion | Parent only |
Statement of income (85 items)
| Item | Value | Consolidated / Non-consolidated |
|---|---|---|
| Other | ¥74.00 million | Consolidated |
| Other | ¥77.00 million | Consolidated |
| Other comprehensive income | ¥4.2 billion | Consolidated |
| Business structure improvement expenses | ¥0.5 billion | Consolidated |
| Dividends from surplus | ¥-1.3 billion | Consolidated |
| Comprehensive income | ¥10.6 billion | Consolidated |
| Interest income | ¥0.3 billion | Consolidated |
| Dividend income | ¥1.00 million | Consolidated |
| Operating income | ¥5.8 billion | Consolidated |
| Non-operating income | ¥2.4 billion | Consolidated |
| Non-operating expenses | ¥0.7 billion | Consolidated |
| Net cash provided by (used in) operating activities | ¥12.0 billion | Consolidated |
| Loss on disposal of noncurrent assets | ¥0.2 billion | Consolidated |
| Gain on sale of fixed assets | ¥0.4 billion | Consolidated |
| Cost of sales | ¥96.2 billion | Consolidated |
| Gross profit (loss) | ¥20.9 billion | Consolidated |
| Net sales | ¥117.1 billion | Consolidated |
| Net income | ¥6.2 billion | Consolidated |
| Net income | ¥6.2 billion | Consolidated |
| Net income (loss) | ¥6.3 billion | Consolidated |
| Net income (loss) | ¥6.3 billion | Consolidated |
| Net cash provided by (used in) investing activities | ¥-10.8 billion | Consolidated |
| Share of profit of investments accounted for using equity method | ¥2.0 billion | Consolidated |
| Share of other comprehensive income of investments accounted for using equity method | ¥0.6 billion | Consolidated |
| Interest expenses | ¥0.2 billion | Consolidated |
| Issuance of new shares | ¥26.00 million | Consolidated |
| Income taxes - current | ¥1.6 billion | Consolidated |
| Income taxes | ¥1.0 billion | Consolidated |
| Income taxes - deferred | ¥-0.6 billion | Consolidated |
| Foreign exchange losses | ¥0.4 billion | Consolidated |
| Foreign currency translation adjustment net of tax | ¥1.3 billion | Consolidated |
| Extraordinary income | ¥0.4 billion | Consolidated |
| Extraordinary loss | ¥0.6 billion | Consolidated |
| Effect of exchange rate change on cash and cash equivalents | ¥0.7 billion | Consolidated |
| Net increase (decrease) in cash and cash equivalents | ¥-0.2 billion | Consolidated |
| Research and development expenses | ¥5.6 billion | Consolidated |
| Income (loss) before income taxes | ¥7.4 billion | Consolidated |
| Income (loss) before income taxes | ¥7.4 billion | Consolidated |
| Ordinary income | ¥7.6 billion | Consolidated |
| Salaries | ¥1.6 billion | Consolidated |
| Purchase of treasury stock | ¥-0 | Consolidated |
| Comprehensive income attributable to owners of parent | ¥10.3 billion | Consolidated |
| Net cash provided by (used in) financing activities | ¥-2.1 billion | Consolidated |
| Selling, general and administrative expenses | ¥15.1 billion | Consolidated |
| Provision for bonuses | ¥0.5 billion | Consolidated |
| Remeasurements of defined benefit plans net of tax | ¥2.3 billion | Consolidated |
| Retirement benefit expenses | ¥0.3 billion | Consolidated |
| Freightage expenses | ¥2.1 billion | Consolidated |
| Comprehensive income attributable to non-controlling interests | ¥0.2 billion | Consolidated |
| Net income (loss) attributable to non-controlling interests | ¥0.1 billion | Consolidated |
| Other | ¥77.00 million | Parent only |
| Business structure improvement expenses | ¥0.4 billion | Parent only |
| Dividends from surplus | ¥-1.3 billion | Parent only |
| Interest income | ¥0.4 billion | Parent only |
| Dividend income | ¥7.7 billion | Parent only |
| Operating income | ¥1.2 billion | Parent only |
| Non-operating income | ¥8.3 billion | Parent only |
| Non-operating expenses | ¥0.4 billion | Parent only |
| Loss on disposal of noncurrent assets | ¥99.00 million | Parent only |
| Gain on sale of fixed assets | ¥0.2 billion | Parent only |
| Fixed asset rent | ¥88.00 million | Parent only |
| Rent expenses on non-current assets | ¥67.00 million | Parent only |
| Cost of sales | ¥68.4 billion | Parent only |
| Gross profit (loss) | ¥14.4 billion | Parent only |
| Net sales | ¥82.8 billion | Parent only |
| Net income (loss) | ¥7.9 billion | Parent only |
| Net income (loss) | ¥7.9 billion | Parent only |
| Interest expenses | ¥0.1 billion | Parent only |
| Issuance of new shares | ¥26.00 million | Parent only |
| Income taxes - current | ¥0.9 billion | Parent only |
| Income taxes | ¥0.8 billion | Parent only |
| Income taxes - deferred | ¥-0.1 billion | Parent only |
| Depreciation | ¥0.2 billion | Parent only |
| Foreign exchange losses | ¥0.2 billion | Parent only |
| Extraordinary income | ¥0.2 billion | Parent only |
| Extraordinary loss | ¥0.5 billion | Parent only |
| Research and development expenses | ¥4.9 billion | Parent only |
| Income (loss) before income taxes | ¥8.7 billion | Parent only |
| Ordinary income | ¥9.0 billion | Parent only |
| Purchase of treasury stock | ¥-0 | Parent only |
| Provision for product warranties | ¥9.00 million | Parent only |
| Selling, general and administrative expenses | ¥13.3 billion | Parent only |
| Provision for bonuses | ¥0.3 billion | Parent only |
| Retirement benefit expenses | ¥0.2 billion | Parent only |
| Freightage expenses | ¥2.0 billion | Parent only |
Statement of changes in equity (3 items)
| Item | Value | Consolidated / Non-consolidated |
|---|---|---|
| Total changes during the period | ¥9.2 billion | Consolidated |
| Net changes in items other than shareholders' equity | ¥4.2 billion | Consolidated |
| Total changes during the period | ¥6.6 billion | Parent only |
Statement of cash flows (29 items)
| Item | Value | Consolidated / Non-consolidated |
|---|---|---|
| Other | ¥-0.3 billion | Consolidated |
| Other | ¥0.3 billion | Consolidated |
| Other | ¥-0 | Consolidated |
| Increase (decrease) in other current liabilities | ¥-1.9 billion | Consolidated |
| Decrease (increase) in other current assets | ¥-0.5 billion | Consolidated |
| Repayments of lease obligations | ¥-0.7 billion | Consolidated |
| Increase decrease in notes and accounts payable trade | ¥-4.7 billion | Consolidated |
| Interest expenses paid | ¥-0.3 billion | Consolidated |
| Interest and dividends income received | ¥7.5 billion | Consolidated |
| Interest and dividend income | ¥-0.3 billion | Consolidated |
| Loss (gain) on disposal of non-current assets | ¥-0.2 billion | Consolidated |
| Decrease increase in notes and accounts receivable trade | ¥4.1 billion | Consolidated |
| Subtotal | ¥6.7 billion | Consolidated |
| Equity in earnings losses of affiliates | ¥-2.0 billion | Consolidated |
| Interest expenses | ¥0.2 billion | Consolidated |
| Purchase of property plant and equipment | ¥-4.6 billion | Consolidated |
| Proceeds from sales of property plant and equipment | ¥0.4 billion | Consolidated |
| Decrease (increase) in inventories | ¥0.3 billion | Consolidated |
| Income taxes paid | ¥-1.9 billion | Consolidated |
| Depreciation | ¥5.9 billion | Consolidated |
| Purchase of intangible assets | ¥-11.00 million | Consolidated |
| Decrease/increase in short-term loans payable | ¥-13.00 million | Consolidated |
| Net decrease increase in short term loans receivable | ¥-6.9 billion | Consolidated |
| Increase (decrease) in provisions for product warranties | ¥-0.6 billion | Consolidated |
| Increase (decrease) in allowance for doubtful accounts | ¥-14.00 million | Consolidated |
| Increase (decrease) in provision for bonuses | ¥-0.3 billion | Consolidated |
| Increase (decrease) in net defined benefit liability | ¥-0.3 billion | Consolidated |
| Dividends | ¥-1.3 billion | Consolidated |
| Dividends paid to non-controlling interests | ¥-0.1 billion | Consolidated |
Accounts unique to this company (3 items)
| Item | Value | Consolidated / Non-consolidated |
|---|---|---|
| Revenue | ¥3.3 billion | Consolidated |
| Revenue | ¥2.2 billion | Consolidated |
| Revenue | ¥2.1 billion | Parent only |
Basic indicators
| Item | Value | Consolidated / Non-consolidated | Source |
|---|---|---|---|
| Net cash provided by (used in) operating activities | ¥12.0 billion | Consolidated | Disclosed |
| Dividend per share | 14 | Parent only | Disclosed |
| Number of employees | 2,693 | Consolidated | Disclosed |
| Net assets | ¥80.1 billion | Consolidated | Disclosed |
| Net sales | ¥117.1 billion | Consolidated | Disclosed |
| Operating income | ¥5.8 billion | Consolidated | Disclosed |
| Ordinary income | ¥7.6 billion | Consolidated | Disclosed |
| Net income | ¥6.2 billion | Consolidated | Disclosed |
| Total assets | ¥129.6 billion | Consolidated | Disclosed |
| Operating margin | 5.0% | Consolidated | Calculated |
| Net margin | 5.3% | Consolidated | Calculated |
| Sales per employee | 43479020 yen | Consolidated | Calculated |
| Total asset turnover | 0.9 times | Consolidated | Calculated |
| Net assets to total assets | 61.8% | Consolidated | Calculated |