DAIFUKU
DAIFUKU CO., LTD.
Company highlights
Long from order to installation, and still selling after that.
Vol.7, Chapter 5 (as of 2026-08-31)
Key figures
Period Jan 2025 to Dec 2025ConsolidatedJapanese GAAP
Business revenue model
Featured in
Vol.7, Chapter 5 (as of 2026-08-31)
“Kaisha no Shikumi: The Companies You Use Every Day”, Chapter 5: Daifuku: More Than 500 Airports and 35,000 Automated Warehouses
Book’s reference date 2026-08-31 / data last checked 2026-10-20
Key points in this volumeA company's profits depend not just on how advanced its technology is, but on how hard it is for customers to switch suppliers.
Warehouses for online retail, baggage handling at airports, semiconductor plants. This company's material handling systems are at work in all of them. The company says its equipment is used at more than 500 airports worldwide.
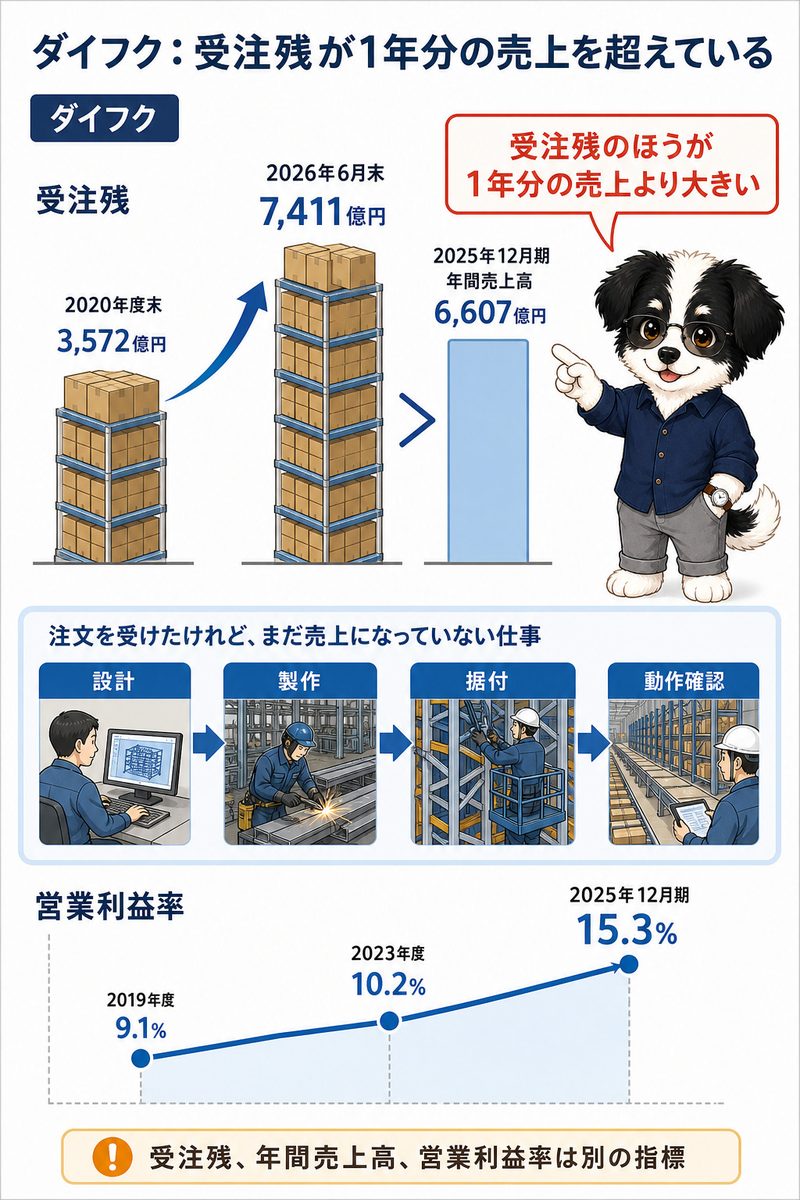
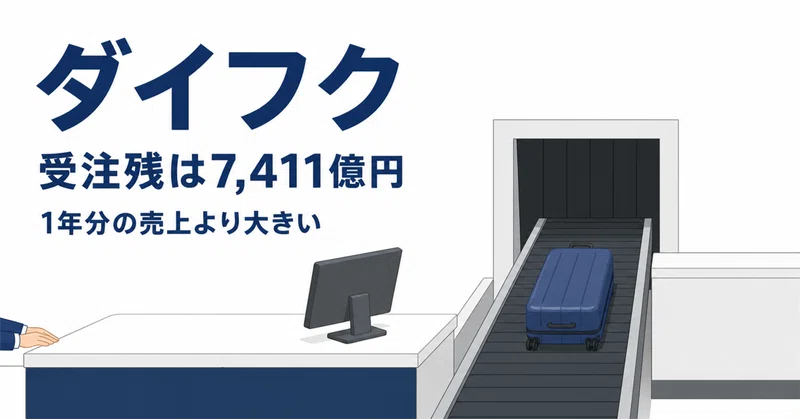
Its order backlog at the end of June 2026 was ¥741.1 billion, above the ¥660.7 billion of annual net sales for the year ended December 2025. Because installation takes time after an order, results move with a lag behind the waves of ordering. Once installed, inspection, parts and maintenance sales accumulate.
The move that changed Daifuku
Daifuku selects its orders for profitability, standardises its products, and has raised service sales after installation to 27% of sales.
Because so much time passes between an order and the sale being recorded, the selection of which projects to take on affects the margin.
Coverage in the book
- An Order Backlog of ¥741.1 Billion, Larger Than a Year of Sales
- How Far "World's Largest" Reaches
- The Customers' Industries, and the Swing in Orders
- The Operating Margin Went from the 9% Range to 15.3%
- Maintenance and Refits Make Up 27% of Sales
Related books, articles and videos
 “Kaisha no Shikumi: The Companies You Use Every Day”
Chapter 5: DAIFUKU
“Daifuku: More Than 500 Airports and 35,000 Automated Warehouses”
“Ano Kaisha no Shikumi” series, Vol.7 — Kindle and paperback
Find it on Amazon →

Company profile
Tables scroll sideways
Disclosed data
Business activities and revenue composition
DAIFUKU
Revenue and profit by business segment
Period Jan 2025 to Dec 2025Source Annual securities reportsConsolidated・Disclosed
| Business | Net sales to external customers | ||
|---|---|---|---|
| This year | Share | Last year | |
| DAIFUKU | ¥246.6 billion | 48.2% | ¥188.1 billion |
| DNA | ¥165.9 billion | 32.5% | ¥172.5 billion |
| DSA | ¥41.0 billion | 8.0% | ¥53.4 billion |
| CFI | ¥37.6 billion | 7.4% | ¥25.9 billion |
| Contec | ¥20.2 billion | 4.0% | ¥17.0 billion |
| Total of the businesses | ¥511.2 billion | 100.0% | |
Revenue and profit
DAIFUKU
Period Jan 2025 to Dec 2025Source Annual securities reports
Amounts by account
| Group | Account | Amount | Consolidated / Non-consolidated |
|---|---|---|---|
| Selling, general and administrative expenses | General and administrative expenses | ¥40.5 billion | Consolidated |
| Selling expenses | ¥20.4 billion | Consolidated | |
| Salaries and bonuses | ¥10.9 billion | Parent only | |
| Research and development expenses | ¥5.4 billion | Consolidated | |
| Experiment and research expenses | ¥3.3 billion | Parent only | |
| Welfare expenses | ¥1.5 billion | Consolidated | |
| Directors' compensations | ¥1.2 billion | Consolidated | |
| Sales commission | ¥0.6 billion | Consolidated | |
| Advertising expenses | ¥0.4 billion | Consolidated | |
| Rent expenses | ¥0.2 billion | Consolidated | |
| Depreciation | ¥0.2 billion | Consolidated | |
| Retirement benefit expenses | ¥21.00 million | Parent only | |
| Provision of allowance for doubtful accounts | ¥-0 | Parent only | |
| Profit by stage | Gross profit (loss) | ¥161.7 billion | Consolidated |
| Ordinary income | ¥104.6 billion | Consolidated | |
| Operating income | ¥100.8 billion | Consolidated | |
| Net income | ¥78.1 billion | Consolidated |
DAIFUKU
Selling, general and administrative expenses
Period Jan 2025 to Dec 2025Source Annual securities reports
- General and administrative expenses ¥40.5 billion
- Selling expenses ¥20.4 billion
- Salaries and bonuses ¥10.9 billion
- Research and development expenses ¥5.4 billion
- Experiment and research expenses ¥3.3 billion
- Welfare expenses ¥1.5 billion
Performance, financial position and capital allocation
Long-term changes in performance
DAIFUKU
Long-term revenue, profit and asset trends
Period 2013 to 2025Source Annual securities reportsDisclosed
DAIFUKU
Recent performance trends
Source Annual securities reports
Year-on-year comparison
| Item | 2021 | 2022 | 2023 | 2024 | 2025 |
|---|---|---|---|---|---|
| Net sales | ¥512.3B | ¥601.9B | ¥611.5B | ¥563.2B | ¥660.7B |
| Year on year (%) | comparison basis not confirmed | +17.5% | +1.6% | comparison basis not confirmed | +17.3% |
| Ordinary income (loss) | ¥51.3B | ¥59.8B | ¥64.2B | ¥74.5B | ¥104.6B |
| Change from prior year | comparison basis not confirmed | +16.6% | +7.4% | comparison basis not confirmed | +40.5% |
| Ordinary income (loss) as a share of Net sales | 10.0% | 9.9% | 10.5% | 13.2% | 15.8% |
| Change (percentage points) | comparison basis not confirmed | -0.1 points | +0.6 points | comparison basis not confirmed | +2.6 points◆ |
Fiscal periods marked for changes
Earlier fiscal periods (2)
- 2016Net sales year on year +25.8%
- 2018Net sales year on year +26.2%, Ordinary income (loss) as a share of revenue +2.7 points
- 2019Ordinary income (loss) as a share of revenue +2.0 points
- 2020Ordinary income (loss) as a share of revenue -2.9 points
- 2025Ordinary income (loss) as a share of revenue +2.6 points
DAIFUKU
Earnings and net assets per share over time
Unit yenSource Annual securities reports
DAIFUKU
Return on equity over time
Unit %Source Annual securities reports
Consolidated indicators (15 items)
| Item | 4 years ago | 3 years ago | 2 years ago | Last year | This year |
|---|---|---|---|---|---|
| Net sales | ¥512.3 billion | ¥601.9 billion | ¥611.5 billion | ¥563.2 billion | ¥660.7 billion |
| Ordinary income (loss) | ¥51.3 billion | ¥59.8 billion | ¥64.2 billion | ¥74.5 billion | ¥104.6 billion |
| Net income (loss) attributable to owners of parent | ¥35.9 billion | ¥41.2 billion | ¥45.5 billion | ¥57.1 billion | ¥78.1 billion |
| Comprehensive income | ¥46.4 billion | ¥53.6 billion | ¥60.4 billion | ¥67.8 billion | ¥77.8 billion |
| Net assets | ¥292.1 billion | ¥332.3 billion | ¥358.8 billion | ¥398.4 billion | ¥451.6 billion |
| Total assets | ¥483.3 billion | ¥551.6 billion | ¥646.2 billion | ¥688.7 billion | ¥754.2 billion |
| Net assets per share | 769.13 yen | 878.24 yen | 966.98 yen | 1,082.71 yen | 1,228 yen |
| Basic earnings (loss) per share | 94.9 yen | 109.11 yen | 121.63 yen | 154.21 yen | 212.39 yen |
| Diluted earnings per share | Could not be retrieved | Could not be retrieved | 118.45 yen | 147.11 yen | 202.51 yen |
| Equity-to-asset ratio | 60.2% | 60.2% | 55.5% | 57.8% | 59.9% |
| Return on equity | 13.1% | 13.2% | 13.2% | 15.1% | 18.4% |
| Net cash provided by (used in) operating activities | ¥56.7 billion | ¥20.0 billion | ¥37.1 billion | ¥116.1 billion | ¥76.1 billion |
| Net cash provided by (used in) investing activities | ¥-9.8 billion | ¥-11.9 billion | ¥-29.6 billion | ¥-2.4 billion | ¥-24.3 billion |
| Net cash provided by (used in) financing activities | ¥-27.6 billion | ¥-30.2 billion | ¥22.7 billion | ¥-36.8 billion | ¥-27.4 billion |
| Cash and cash equivalents | ¥118.7 billion | ¥102.4 billion | ¥136.4 billion | ¥220.4 billion | ¥245.3 billion |
Parent only indicators (15 items)
| Item | 4 years ago | 3 years ago | 2 years ago | Last year | This year |
|---|---|---|---|---|---|
| Net sales | ¥266.5 billion | ¥290.3 billion | ¥274.5 billion | ¥216.8 billion | ¥287.4 billion |
| Ordinary income (loss) | ¥39.8 billion | ¥45.5 billion | ¥47.2 billion | ¥34.9 billion | ¥66.6 billion |
| Net income (loss) | ¥28.7 billion | ¥34.1 billion | ¥33.2 billion | ¥29.2 billion | ¥55.6 billion |
| Capital stock | ¥31.9 billion | ¥31.9 billion | ¥31.9 billion | ¥31.9 billion | ¥31.9 billion |
| Total number of issued shares (common stock) | 379,830,000 shares | 379,830,000 shares | 379,830,000 shares | 379,830,000 shares | 379,830,000 shares |
| Net assets | ¥221.9 billion | ¥244.6 billion | ¥247.4 billion | ¥246.6 billion | ¥275.4 billion |
| Total assets | ¥330.1 billion | ¥349.9 billion | ¥400.6 billion | ¥396.9 billion | ¥433.6 billion |
| Net assets per share | 587.01 yen | 646.91 yen | 667.6 yen | 670.65 yen | 748.88 yen |
| Dividend per share | 90 yen | 110 yen | 40 yen | 55 yen | 78 yen |
| Interim dividend per share | 35 yen | 40 yen | 14 yen | 23 yen | 34 yen |
| Basic earnings (loss) per share | 75.79 yen | 90.08 yen | 88.89 yen | 79.02 yen | 151.24 yen |
| Diluted earnings per share | Could not be retrieved | Could not be retrieved | 86.51 yen | 75.24 yen | 144.1 yen |
| Equity-to-asset ratio | 67.2% | 69.9% | 61.8% | 62.1% | 63.5% |
| Return on equity | 13.4% | 14.6% | 13.5% | 11.8% | 21.3% |
| Payout ratio | 39.6% | 40.7% | 45.0% | 69.6% | 51.6% |
Dividend history
| Fiscal year | Annual dividend per share | Of which interim | Payout ratio (as reported, parent only) | Flag |
|---|---|---|---|---|
| FY ending 12/2025 | ¥78 | ¥34 | 51.6% | |
| FY ending 12/2024 | ¥55 | ¥23 | 69.6% | Stock split or share consolidation noted, Fiscal year was not 12 months, Fiscal year was not 12 months |
| FY ending 3/2023 | ¥110 | ¥40 | 40.7% | |
| FY ending 3/2022 | ¥90 | ¥35 | 39.6% | |
| FY ending 3/2021 | ¥80 | ¥30 | 38.7% | |
| FY ending 3/2020 | ¥75 | ¥30 | 50.5% | |
| FY ending 3/2019 | ¥90 | ¥30 | 33.5% | |
| FY ending 3/2018 | ¥70 | ¥25 | 34.2% | |
| FY ending 3/2017 | ¥42 | ¥12 | 38.4% | |
| FY ending 3/2016 | ¥30 | ¥10 | 40.8% | |
| FY ending 3/2015 | ¥22 | ¥7 | 34.6% | |
| FY ending 3/2014 | ¥18 | ¥5 | 34.6% | |
| FY ending 3/2013 | ¥15 | ¥5 | 29.6% |
DAIFUKU
Dividends per share over time
Unit yenSource Annual securities reports
Shareholder composition
Share ownership by holder category
DAIFUKU
Unit %Source Annual securities reports
- Financial institutions33.22%
- Securities firms3.81%
- Other corporations4.47%
- Foreign holders (institutions)45.78%
- Foreign holders (individuals)0.02%
- Individuals and others12.70%
- Government and municipalities0.00%
Major shareholders
| Rank | Shareholder | Shareholding ratio | Shares held |
|---|---|---|---|
| 1 | 日本マスタートラスト信託銀行株式会社(信託口) | 14.22% | 52,354,000 |
| 2 | 株式会社日本カストディ銀行(信託口) | 8.63% | 31,761,000 |
| 3 | STATE STREET BANK AND TRUST COMPANY 505025(常任代理人 株式会社みずほ銀行決済営業部) | 2.69% | 9,896,000 |
| 4 | 株式会社みずほ銀行 | 2.52% | 9,265,000 |
| 5 | ダイフク取引先持株会 | 2.37% | 8,717,000 |
| 6 | 日本生命保険相互会社 | 2.24% | 8,237,000 |
| 7 | STATE STREET BANK AND TRUST CO MPANY 505038(常任代理人 株式会社みずほ銀行決済営業部) | 1.83% | 6,749,000 |
| 8 | BNYM AS AGT/CLTS 10 PERCENT (常任代理人 株式会社三菱UFJ銀行決済事業部) | 1.82% | 6,685,000 |
| 9 | 中央日本土地建物株式会社 | 1.81% | 6,674,000 |
| 10 | STATE STREET BANK AND TRUST COMPANY 505001(常任代理人 株式会社みずほ銀行決済営業部) | 1.77% | 6,517,000 |
Research and development expenses and capital expenditure
| Fiscal year | Research and development | Capital expenditure |
|---|---|---|
| FY ending 12/2025 | ¥13.2 billion | ¥33.3 billion |
| FY ending 12/2024 | ¥9.3 billion | Could not be retrieved |
| FY ending 3/2021 | ¥9.2 billion | ¥7.5 billion |
| FY ending 3/2020 | ¥8.9 billion | Could not be retrieved |
| FY ending 3/2017 | ¥7.5 billion | Could not be retrieved |
| FY ending 3/2016 | ¥7.0 billion | Could not be retrieved |
Research and development expenses and capital expenditure by segment (FY ending 12/2025)
| Segment | Research and development |
|---|---|
| DAIFUKU | ¥10.5 billion |
| DNA | ¥0.9 billion |
| CFI | ¥0.4 billion |
| Contec | ¥1.2 billion |
Revenue scale in the same industry
DAIFUKU
Source Annual securities reports of each company
Machinery: 221 companies · revenue · largest first・each company’s latest fiscal year・Consolidated・Disclosed
- 1 DAIKIN INDUSTRIESFY Mar 2026 ¥5.0T
- 2 Mitsubishi Heavy IndustriesFY Mar 2026 ¥5.0T
- 3 KUBOTAFY Dec 2025 ¥3.0T
- … 8 companies
- 12 NTNFY Mar 2026 ¥826.3B
- 13 MakitaFY Mar 2026 ¥777.6B
- 14 DAIFUKUThis companyFY Dec 2025 ¥660.7B
- 15 KanadeviaFY Mar 2026 ¥645.2B
- 16 SEGA SAMMYFY Mar 2026 ¥487.5B
- … 205 companies
Workforce information
Women 13.5 yrs Average length of service by gender
Women 548 Employees by gender
Administrative filings and published information
Workplace information filings
| Item | Value |
|---|---|
| Employees | 3,691 |
| Average monthly overtime (statutory overtime plus work on statutory days off) |
19.9 hours |
| Annual paid leave taken |
94.3% |
| Childcare leave taken, men |
85.5% |
| Childcare leave taken, women |
250% |
| Share of managers who are women | 7.1% |
| Share of board members who are women | 21.4% |
Greenhouse gas emissions
| Category | Emissions |
|---|---|
| 特定事業所排出者 | 10,094 t-CO2 |
| Sites covered by the report | 1 |
Audit and disclosure information
| Item | Value |
|---|---|
| Audit firm | PwCJapan有限責任監査法人 |
| Audit fees (this year, total) | ¥0.1 billion |
| Non-audit fees (this year, total) | Not applicable |
| Audit fees (this year, network firms) | ¥0.5 billion |
| Non-audit fees (this year, network firms) | ¥0.2 billion |
| Going concern note | Cannot be determined |
| Accounting standard | Japanese GAAP |
Sources and methodology
Retrieved disclosed figures
Major management indicators (5 years) (30 items)
| Item | Value | Consolidated / Non-consolidated |
|---|---|---|
| Comprehensive income | ¥77.8 billion | Consolidated |
| Net cash provided by (used in) operating activities | ¥76.1 billion | Consolidated |
| Net sales | ¥660.7 billion | Consolidated |
| Net cash provided by (used in) investing activities | ¥-24.3 billion | Consolidated |
| Diluted earnings per share | 202.51 yen | Consolidated |
| Cash and cash equivalents | ¥245.3 billion | Consolidated |
| Net assets | ¥451.6 billion | Consolidated |
| Ordinary income (loss) | ¥104.6 billion | Consolidated |
| Total assets | ¥754.2 billion | Consolidated |
| Return on equity | 18.4% | Consolidated |
| Equity-to-asset ratio | 59.9% | Consolidated |
| Net income (loss) attributable to owners of parent | ¥78.1 billion | Consolidated |
| Net cash provided by (used in) financing activities | ¥-27.4 billion | Consolidated |
| Basic earnings (loss) per share | 212.39 yen | Consolidated |
| Net assets per share | 1,228 yen | Consolidated |
| Dividend per share | 78 yen | Parent only |
| Net sales | ¥287.4 billion | Parent only |
| Net income (loss) | ¥55.6 billion | Parent only |
| Diluted earnings per share | 144.1 yen | Parent only |
| Total number of issued shares (common stock) | 379,830,000 shares | Parent only |
| Net assets | ¥275.4 billion | Parent only |
| Ordinary income (loss) | ¥66.6 billion | Parent only |
| Total assets | ¥433.6 billion | Parent only |
| Return on equity | 21.3% | Parent only |
| Equity-to-asset ratio | 63.5% | Parent only |
| Capital stock | ¥31.9 billion | Parent only |
| Payout ratio | 51.6% | Parent only |
| Interim dividend per share | 34 yen | Parent only |
| Basic earnings (loss) per share | 151.24 yen | Parent only |
| Net assets per share | 748.88 yen | Parent only |
Employees (10 items)
| Item | Value | Consolidated / Non-consolidated |
|---|---|---|
| Number of employees | 11,417 people | Consolidated |
| Number of employees | 11,417 people | Consolidated |
| Wage gap between men and women (all employees) | 74.0% | Parent only |
| Average length of service (years) | 14.7 years | Parent only |
| Average annual salary | ¥9.18 million | Parent only |
| Average age (years) | 41.6 years old | Parent only |
| Number of employees | 3,858 people | Parent only |
| Number of employees | 3,858 people | Parent only |
| Wage gap between men and women (regular employees) | 77.5% | Parent only |
| Wage gap between men and women (non-regular employees) | 69.8% | Parent only |
Other disclosed items (7 items)
| Item | Value | Consolidated / Non-consolidated |
|---|---|---|
| Goodwill before offsetting | ¥1.9 billion | Consolidated |
| Number of consolidated subsidiaries | 61 companies | Consolidated |
| Rate of male employees taking childcare leave (all employees) | 85.5% | Parent only |
| Average number of temporary employees | 228 people | Parent only |
| Average number of temporary employees | 228 people | Parent only |
| Total return on the share price index | 277.3% | Parent only |
| Ratio of female employees in managerial positions | 6.9% | Parent only |
Shares (16 items)
| Item | Value | Consolidated / Non-consolidated |
|---|---|---|
| Number of shares held | 146,857,000 shares | Consolidated |
| Total number of shares held treasury shares etc | 11,684,500 shares | Consolidated |
| Number of issues whose number of shares increased shares other than those not listed investment shares held for purposes other than pure investment reporting company | 2 issues | Consolidated |
| Number of issues whose number of shares decreased shares other than those not listed investment shares held for purposes other than pure investment reporting company | 9 issues | Consolidated |
| Total acquisition cost for increased shares shares other than those not listed investment shares held for purposes other than pure investment reporting company | ¥14.00 million | Consolidated |
| Total sale amount for decreased shares shares other than those not listed investment shares held for purposes other than pure investment reporting company | ¥5.7 billion | Consolidated |
| Number of shares | 379,830,231 shares | Consolidated |
| Shareholding ratio treasury shares etc | 3.1% | Consolidated |
| Shareholding ratio | 39.9% | Consolidated |
| Number of shares held in own name treasury shares etc | 11,684,500 shares | Consolidated |
| Number of voting rights | 3,679,610 units | Consolidated |
| Carrying amount on the balance sheet | ¥0.2 billion | Consolidated |
| Carrying amount on the balance sheet | ¥6.7 billion | Consolidated |
| Number of issues | 5 issues | Consolidated |
| Number of issues | 18 issues | Consolidated |
| Total shareholder return | 227.5% | Parent only |
Research and development (2 items)
| Item | Value | Consolidated / Non-consolidated |
|---|---|---|
| Research and development expenses included in general and administrative expenses and manufacturing cost for current period | ¥13.2 billion | Consolidated |
| Research and development expenses | ¥13.2 billion | Consolidated |
Property and facilities (1 items)
| Item | Value | Consolidated / Non-consolidated |
|---|---|---|
| Capital expenditures | ¥33.3 billion | Consolidated |
Audit (9 items)
| Item | Value | Consolidated / Non-consolidated |
|---|---|---|
| Fees for audit and attestation services - reporting company | ¥0.2 billion | Consolidated |
| Fees for audit and attestation services - reporting company | ¥0.1 billion | Consolidated |
| Fees for audit and attestation services - total | ¥0.5 billion | Consolidated |
| Fees for audit and attestation services - total | ¥0.1 billion | Consolidated |
| Fees for audit and attestation services - consolidated subsidiaries | ¥0.3 billion | Consolidated |
| Fees for audit and attestation services - consolidated subsidiaries | ¥15.00 million | Consolidated |
| Fees for non-audit services - reporting company | ¥76.00 million | Consolidated |
| Fees for non-audit services - total | ¥0.2 billion | Consolidated |
| Non audit fees consolidated subsidiaries network firms | ¥0.1 billion | Consolidated |
Balance sheet (142 items)
| Item | Value | Consolidated / Non-consolidated |
|---|---|---|
| Other | ¥7.5 billion | Consolidated |
| Other | ¥4.4 billion | Consolidated |
| Other | ¥37.1 billion | Consolidated |
| Other | ¥21.5 billion | Consolidated |
| Other | ¥1.7 billion | Consolidated |
| Other provision | ¥0.7 billion | Consolidated |
| Valuation difference on available-for-sale securities | ¥3.3 billion | Consolidated |
| Other, net | ¥7.2 billion | Consolidated |
| Goodwill | ¥1.9 billion | Consolidated |
| Software | ¥9.3 billion | Consolidated |
| Retained earnings | ¥381.0 billion | Consolidated |
| Raw materials and supplies | ¥31.4 billion | Consolidated |
| Notes receivable - trade | ¥3.2 billion | Consolidated |
| Merchandise and finished goods | ¥10.8 billion | Consolidated |
| Non-current liabilities | ¥75.5 billion | Consolidated |
| Non-current assets | ¥170.4 billion | Consolidated |
| Land | ¥13.6 billion | Consolidated |
| Contract liabilities | ¥74.2 billion | Consolidated |
| Contract assets net | ¥118.5 billion | Consolidated |
| Allowance for construction loss | ¥0.2 billion | Consolidated |
| Tools, furniture and fixtures | ¥5.8 billion | Consolidated |
| Buildings and structures, net | ¥56.8 billion | Consolidated |
| Construction in progress | ¥5.9 billion | Consolidated |
| Investments and other assets | ¥49.4 billion | Consolidated |
| Investment securities | ¥7.3 billion | Consolidated |
| Notes payable accounts payable for construction contracts and other cns | ¥66.8 billion | Consolidated |
| Property, plant and equipment | ¥108.1 billion | Consolidated |
| Costs on uncompleted construction contracts and other cns | ¥21.9 billion | Consolidated |
| Income taxes payable | ¥15.4 billion | Consolidated |
| Shareholders' equity | ¥402.6 billion | Consolidated |
| Machinery, equipment and vehicles, net | ¥18.8 billion | Consolidated |
| Current liabilities | ¥227.2 billion | Consolidated |
| Current assets | ¥583.8 billion | Consolidated |
| Accumulated depreciation | ¥-81.6 billion | Consolidated |
| Foreign currency translation adjustment | ¥43.8 billion | Consolidated |
| Intangible assets | ¥13.0 billion | Consolidated |
| Cash and cash equivalents | ¥245.3 billion | Consolidated |
| Cash and deposits | ¥261.3 billion | Consolidated |
| Short-term loans payable | ¥0.7 billion | Consolidated |
| Net assets | ¥451.6 billion | Consolidated |
| Net assets | ¥451.6 billion | Consolidated |
| Total assets | ¥754.2 billion | Consolidated |
| Deferred gains or losses on hedges | ¥-0.2 billion | Consolidated |
| Deferred tax liabilities | ¥0.5 billion | Consolidated |
| Deferred tax assets | ¥20.6 billion | Consolidated |
| Treasury stock | ¥-30.7 billion | Consolidated |
| Valuation and translation adjustments | ¥49.0 billion | Consolidated |
| Liabilities | ¥302.6 billion | Consolidated |
| Liabilities and net assets | ¥754.2 billion | Consolidated |
| Allowance for doubtful accounts | ¥-0 | Consolidated |
| Allowance for doubtful accounts | ¥-2.0 billion | Consolidated |
| Capital surplus | ¥20.4 billion | Consolidated |
| Capital stock | ¥31.9 billion | Consolidated |
| Provision for bonuses | ¥16.8 billion | Consolidated |
| Convertible-bond-type bonds with share acquisition rights | ¥60.7 billion | Consolidated |
| Remeasurements of defined benefit plans | ¥2.2 billion | Consolidated |
| Net defined benefit liability | ¥6.0 billion | Consolidated |
| Net defined benefit asset | ¥17.0 billion | Consolidated |
| Long-term loans receivable | ¥0.1 billion | Consolidated |
| Electronically recorded obligations - operating | ¥16.0 billion | Consolidated |
| Non-controlling interests | ¥13.00 million | Consolidated |
| Other | ¥0.3 billion | Parent only |
| Other | ¥0.6 billion | Parent only |
| Other | ¥4.0 billion | Parent only |
| Other | ¥2.0 billion | Parent only |
| Other | ¥0.1 billion | Parent only |
| Other provision | ¥0.5 billion | Parent only |
| Valuation difference on available-for-sale securities | ¥3.2 billion | Parent only |
| Other capital surplus | ¥14.0 billion | Parent only |
| Software | ¥5.9 billion | Parent only |
| Software in progress | ¥0.2 billion | Parent only |
| Lease obligations | ¥1.0 billion | Parent only |
| Lease obligations | ¥0.1 billion | Parent only |
| Lease assets, net | ¥1.1 billion | Parent only |
| General reserve | ¥30.0 billion | Parent only |
| Retained earnings | ¥248.3 billion | Parent only |
| Legal retained earnings | ¥0.1 billion | Parent only |
| Prepaid pension cost | ¥9.2 billion | Parent only |
| Prepaid expenses | ¥1.8 billion | Parent only |
| Raw materials and supplies | ¥18.3 billion | Parent only |
| Notes receivable - trade | ¥0.3 billion | Parent only |
| Merchandise and finished goods | ¥40.00 million | Parent only |
| Non-current liabilities | ¥67.0 billion | Parent only |
| Non-current assets | ¥148.8 billion | Parent only |
| Reserve for advanced depreciation of noncurrent assets | ¥0.3 billion | Parent only |
| Land | ¥7.5 billion | Parent only |
| Accounts receivable - trade | ¥19.7 billion | Parent only |
| Contract liabilities | ¥11.6 billion | Parent only |
| Allowance for construction loss | ¥51.00 million | Parent only |
| Accounts payable for construction contracts | ¥1.2 billion | Parent only |
| Tools, furniture and fixtures | ¥2.4 billion | Parent only |
| Buildings, net | ¥28.3 billion | Parent only |
| Construction in progress | ¥4.1 billion | Parent only |
| Long term loans receivable from employees | ¥0.1 billion | Parent only |
| Investments and other assets | ¥89.0 billion | Parent only |
| Investment securities | ¥6.8 billion | Parent only |
| Lease and guarantee deposits | ¥1.1 billion | Parent only |
| Property, plant and equipment | ¥53.7 billion | Parent only |
| Accounts receivable - other | ¥3.2 billion | Parent only |
| Costs on uncompleted construction contracts and other cns | ¥13.9 billion | Parent only |
| Income taxes payable | ¥9.9 billion | Parent only |
| Accrued expenses | ¥4.4 billion | Parent only |
| Accounts payable - other | ¥11.3 billion | Parent only |
| Shareholders' equity | ¥272.4 billion | Parent only |
| Structures, net | ¥1.6 billion | Parent only |
| Machinery and equipment, net | ¥8.7 billion | Parent only |
| Current liabilities | ¥91.2 billion | Parent only |
| Current assets | ¥284.7 billion | Parent only |
| Intangible assets | ¥6.2 billion | Parent only |
| Cash and deposits | ¥105.2 billion | Parent only |
| Short-term loans payable | ¥4.4 billion | Parent only |
| Short-term loans receivable with resale agreement | ¥46.00 million | Parent only |
| Net assets | ¥275.4 billion | Parent only |
| Net assets | ¥275.4 billion | Parent only |
| Total assets | ¥433.6 billion | Parent only |
| Deferred gains or losses on hedges | ¥-0.2 billion | Parent only |
| Deferred tax assets | ¥9.8 billion | Parent only |
| Retained earnings brought forward | ¥210.9 billion | Parent only |
| Treasury stock | ¥-30.7 billion | Parent only |
| Valuation and translation adjustments | ¥3.0 billion | Parent only |
| Liabilities | ¥158.2 billion | Parent only |
| Liabilities and net assets | ¥433.6 billion | Parent only |
| Accounts payable - trade | ¥15.0 billion | Parent only |
| Allowance for doubtful accounts | ¥-0 | Parent only |
| Allowance for doubtful accounts | ¥-0.2 billion | Parent only |
| Capital surplus | ¥23.0 billion | Parent only |
| Legal capital surplus | ¥9.0 billion | Parent only |
| Capital stock | ¥31.9 billion | Parent only |
| Provision for bonuses | ¥13.6 billion | Parent only |
| Vehicles, net | ¥7.00 million | Parent only |
| Convertible-bond-type bonds with share acquisition rights | ¥60.7 billion | Parent only |
| Provision for retirement benefits | ¥4.3 billion | Parent only |
| Reserve for dividends3 | ¥7.0 billion | Parent only |
| Long-term prepaid expenses | ¥0.2 billion | Parent only |
| Long term accounts payable other | ¥0.1 billion | Parent only |
| Long-term loans receivable | ¥8.00 million | Parent only |
| Investments in capital of subsidiaries and affiliates | ¥6.2 billion | Parent only |
| Shares of subsidiaries and associates | ¥54.8 billion | Parent only |
| Loans receivable to subsidiaries and affiliates | ¥6.4 billion | Parent only |
| Electronically recorded obligations - operating | ¥15.5 billion | Parent only |
| Electronically recorded monetary claims - operating | ¥8.3 billion | Parent only |
| Current portion of long-term loans payable | ¥0.1 billion | Parent only |
Accounts unique to this company (14 items)
| Item | Value | Consolidated / Non-consolidated |
|---|---|---|
| Revenue | ¥238.9 billion | Consolidated |
| Revenue | ¥0.3 billion | Consolidated |
| Revenue | ¥0.6 billion | Consolidated |
| Revenue | ¥11.0 billion | Consolidated |
| Revenue | ¥106.1 billion | Consolidated |
| Revenue | ¥0.8 billion | Consolidated |
| Revenue | ¥11.2 billion | Consolidated |
| Revenue | ¥5.8 billion | Consolidated |
| Revenue | ¥16.6 billion | Consolidated |
| Revenue | ¥2.4 billion | Consolidated |
| Revenue | ¥105.8 billion | Parent only |
| Revenue | ¥1.2 billion | Parent only |
| Revenue | ¥0.1 billion | Parent only |
| Revenue | ¥1.9 billion | Parent only |
Statement of income (111 items)
| Item | Value | Consolidated / Non-consolidated |
|---|---|---|
| Other | ¥0.4 billion | Consolidated |
| Other | ¥48.00 million | Consolidated |
| Other | ¥24.00 million | Consolidated |
| Other | ¥26.00 million | Consolidated |
| Other comprehensive income | ¥-0.3 billion | Consolidated |
| Valuation difference on available for sale securities net of tax | ¥-2.5 billion | Consolidated |
| General and administrative expenses | ¥40.5 billion | Consolidated |
| Dividends from surplus | ¥-24.3 billion | Consolidated |
| Subsidy income | ¥0.6 billion | Consolidated |
| Comprehensive income | ¥77.8 billion | Consolidated |
| Insurance | ¥0.9 billion | Consolidated |
| Interest income | ¥3.1 billion | Consolidated |
| Rent income | ¥0.2 billion | Consolidated |
| Dividend income | ¥0.3 billion | Consolidated |
| Operating income | ¥100.8 billion | Consolidated |
| Non-operating income | ¥4.7 billion | Consolidated |
| Non-operating expenses | ¥0.9 billion | Consolidated |
| Net cash provided by (used in) operating activities | ¥76.1 billion | Consolidated |
| Loss on sale of non-current assets | ¥0 | Consolidated |
| Gain on sales of non-current assets | ¥31.00 million | Consolidated |
| Loss on retirement of non-current assets | ¥0.4 billion | Consolidated |
| Cost of sales | ¥499.1 billion | Consolidated |
| Gross profit (loss) | ¥161.7 billion | Consolidated |
| Net sales | ¥660.7 billion | Consolidated |
| Advertising expenses | ¥0.4 billion | Consolidated |
| Net income | ¥78.1 billion | Consolidated |
| Net income | ¥78.1 billion | Consolidated |
| Net income (loss) | ¥78.1 billion | Consolidated |
| Directors' compensations | ¥1.2 billion | Consolidated |
| Gain on sales of investment securities | ¥4.3 billion | Consolidated |
| Net cash provided by (used in) investing activities | ¥-24.3 billion | Consolidated |
| Interest expenses | ¥0.3 billion | Consolidated |
| Traveling expenses and transportation expenses | ¥1.2 billion | Consolidated |
| Income taxes - current | ¥24.5 billion | Consolidated |
| Income taxes | ¥31.5 billion | Consolidated |
| Income taxes - deferred | ¥6.9 billion | Consolidated |
| Depreciation | ¥3.3 billion | Consolidated |
| Depreciation | ¥0.2 billion | Consolidated |
| Foreign exchange losses | ¥0.5 billion | Consolidated |
| Foreign currency translation adjustment net of tax | ¥1.8 billion | Consolidated |
| Extraordinary income | ¥6.0 billion | Consolidated |
| Extraordinary loss | ¥1.1 billion | Consolidated |
| Early retirement program expenses | ¥92.00 million | Consolidated |
| Effect of exchange rate change on cash and cash equivalents | ¥0.4 billion | Consolidated |
| Net increase (decrease) in cash and cash equivalents | ¥24.9 billion | Consolidated |
| Research and development expenses | ¥5.4 billion | Consolidated |
| Interest on bonds | ¥-0.2 billion | Consolidated |
| Welfare expenses | ¥1.5 billion | Consolidated |
| Income (loss) before income taxes | ¥109.6 billion | Consolidated |
| Income (loss) before income taxes | ¥109.6 billion | Consolidated |
| Ordinary income | ¥104.6 billion | Consolidated |
| Deferred gains or losses on hedges net of tax | ¥-95.00 million | Consolidated |
| Disposal of treasury stock | ¥53.00 million | Consolidated |
| Purchase of treasury stock | ¥-4.00 million | Consolidated |
| Comprehensive income attributable to owners of parent | ¥77.8 billion | Consolidated |
| Net cash provided by (used in) financing activities | ¥-27.4 billion | Consolidated |
| Sales commission | ¥0.6 billion | Consolidated |
| Selling expenses | ¥20.4 billion | Consolidated |
| Selling, general and administrative expenses | ¥60.8 billion | Consolidated |
| Rent expenses | ¥0.2 billion | Consolidated |
| Remeasurements of defined benefit plans net of tax | ¥0.5 billion | Consolidated |
| Gain on abolishment retirement benefit plan | ¥0.7 billion | Consolidated |
| Retirement benefit expenses | ¥-64.00 million | Consolidated |
| Retirement benefit expenses | ¥0.2 billion | Consolidated |
| Changes in equity of parent from transaction of non controlling interest | ¥-0.4 billion | Consolidated |
| Comprehensive income attributable to non-controlling interests | ¥3.00 million | Consolidated |
| Net income (loss) attributable to non-controlling interests | ¥4.00 million | Consolidated |
| Other | ¥0.2 billion | Parent only |
| Other | ¥4.00 million | Parent only |
| Other | ¥1.00 million | Parent only |
| Dividends from surplus | ¥-24.3 billion | Parent only |
| Interest income | ¥0.4 billion | Parent only |
| Rent income | ¥0.2 billion | Parent only |
| Dividend income | ¥24.7 billion | Parent only |
| Total | ¥219.4 billion | Parent only |
| Operating income | ¥40.8 billion | Parent only |
| Non-operating income | ¥25.8 billion | Parent only |
| Non-operating expenses | ¥11.00 million | Parent only |
| Loss on retirement of non-current assets | ¥0.3 billion | Parent only |
| Cost of sales | ¥220.5 billion | Parent only |
| Gross profit (loss) | ¥66.8 billion | Parent only |
| Net sales | ¥287.4 billion | Parent only |
| Net income (loss) | ¥55.6 billion | Parent only |
| Net income (loss) | ¥55.6 billion | Parent only |
| Cost of products manufactured | ¥219.3 billion | Parent only |
| Directors' compensations | ¥0.9 billion | Parent only |
| Gain on sales of investment securities | ¥4.3 billion | Parent only |
| Interest expenses | ¥63.00 million | Parent only |
| Traveling expenses and transportation expenses | ¥1.1 billion | Parent only |
| Income taxes - current | ¥16.1 billion | Parent only |
| Income taxes | ¥15.0 billion | Parent only |
| Income taxes - deferred | ¥-1.1 billion | Parent only |
| Depreciation | ¥1.1 billion | Parent only |
| Foreign exchange gains | ¥0.3 billion | Parent only |
| Extraordinary income | ¥4.3 billion | Parent only |
| Extraordinary loss | ¥0.3 billion | Parent only |
| Interest on bonds | ¥-0.2 billion | Parent only |
| Income (loss) before income taxes | ¥70.6 billion | Parent only |
| Ordinary income | ¥66.6 billion | Parent only |
| Salaries and bonuses | ¥10.9 billion | Parent only |
| Disposal of treasury stock | ¥53.00 million | Parent only |
| Purchase of treasury stock | ¥-4.00 million | Parent only |
| Cost of finished goods sold | ¥220.5 billion | Parent only |
| Ending finished goods cos | ¥41.00 million | Parent only |
| Beginning finished goods cos | ¥40.00 million | Parent only |
| Experiment and research expenses | ¥3.3 billion | Parent only |
| Sales commission | ¥4.1 billion | Parent only |
| Selling, general and administrative expenses | ¥26.0 billion | Parent only |
| Provision of allowance for doubtful accounts | ¥-0 | Parent only |
| Rent expenses | ¥0.9 billion | Parent only |
| Retirement benefit expenses | ¥21.00 million | Parent only |
Statement of changes in equity (4 items)
| Item | Value | Consolidated / Non-consolidated |
|---|---|---|
| Total changes during the period | ¥53.1 billion | Consolidated |
| Net changes in items other than shareholders' equity | ¥-0.3 billion | Consolidated |
| Total changes during the period | ¥28.8 billion | Parent only |
| Net changes in items other than shareholders' equity | ¥-2.6 billion | Parent only |
Statement of cash flows (31 items)
| Item | Value | Consolidated / Non-consolidated |
|---|---|---|
| Other | ¥1.8 billion | Consolidated |
| Other | ¥1.4 billion | Consolidated |
| Other | ¥-0.2 billion | Consolidated |
| Other | ¥-1.8 billion | Consolidated |
| Amortization of goodwill | ¥0.8 billion | Consolidated |
| Increase decrease in notes and accounts payable trade | ¥-0.4 billion | Consolidated |
| Interest expenses paid | ¥-0.3 billion | Consolidated |
| Interest and dividends income received | ¥3.4 billion | Consolidated |
| Interest and dividend income | ¥-3.4 billion | Consolidated |
| Purchase of non-current assets | ¥-22.2 billion | Consolidated |
| Proceeds from sales of non-current assets | ¥49.00 million | Consolidated |
| Loss gain on sales and retirement of noncurrent assets | ¥0.3 billion | Consolidated |
| (Increase) decrease in notes receivable, trade receivables, contract assets and other | ¥-11.9 billion | Consolidated |
| Increase (decrease) in contract liabilities | ¥-11.2 billion | Consolidated |
| Proceeds from withdrawal of time deposits | ¥0.9 billion | Consolidated |
| Payments into time deposits | ¥-14.1 billion | Consolidated |
| Subtotal | ¥89.5 billion | Consolidated |
| Proceeds from redemption of investment securities | ¥5.0 billion | Consolidated |
| Purchase of investment securities | ¥-10.00 million | Consolidated |
| Proceeds from sales of investment securities | ¥6.3 billion | Consolidated |
| Loss (gain) on sales of long-term investment securities | ¥-4.3 billion | Consolidated |
| Interest expenses | ¥0.3 billion | Consolidated |
| Decrease (increase) in inventories | ¥-0.9 billion | Consolidated |
| Income taxes refund (paid) | ¥-17.9 billion | Consolidated |
| Depreciation | ¥9.0 billion | Consolidated |
| Decrease/increase in short-term loans payable | ¥-1.8 billion | Consolidated |
| Interest on bonds | ¥-0.2 billion | Consolidated |
| Regarding purchase of treasury stock | ¥-4.00 million | Consolidated |
| Proceeds from sales of treasury stock | ¥3.00 million | Consolidated |
| Payments from changes in ownership interests in subsidiaries that do not result in change in scope of consolidation | ¥-0.4 billion | Consolidated |
| Dividends | ¥-23.4 billion | Consolidated |
Basic indicators
| Item | Value | Consolidated / Non-consolidated | Source |
|---|---|---|---|
| Net cash provided by (used in) operating activities | ¥76.1 billion | Consolidated | Disclosed |
| Dividend per share | 78 | Parent only | Disclosed |
| Number of employees | 11,417 | Consolidated | Disclosed |
| Net assets | ¥451.6 billion | Consolidated | Disclosed |
| Net sales | ¥660.7 billion | Consolidated | Disclosed |
| Operating income | ¥100.8 billion | Consolidated | Disclosed |
| Ordinary income | ¥104.6 billion | Consolidated | Disclosed |
| Net income | ¥78.1 billion | Consolidated | Disclosed |
| Total assets | ¥754.2 billion | Consolidated | Disclosed |
| Operating margin | 15.3% | Consolidated | Calculated |
| Net margin | 11.8% | Consolidated | Calculated |
| Sales per employee | 57871945 yen | Consolidated | Calculated |
| Total asset turnover | 0.88 times | Consolidated | Calculated |
| Net assets to total assets | 59.9% | Consolidated | Calculated |