ADVANTEST
ADVANTEST CORPORATION
Company highlights
Semiconductors are made by separate companies or divisions that divide design, manufacturing, and testing among them, and the prices and supply volumes of equipment and materials are set by product specifications, contract terms, factory production capacity, and inventory levels. The time between receiving an order and shipment, customer acceptance, revenue recognition, and receipt of payment depends on the contract, and investment in factories and equipment also becomes an expense through depreciation, spread over several years after the assets start operating.
Vol.2, Chapter 1 (as of 2026-09-20)
Key figures
Period Apr 2025 to Mar 2026ConsolidatedIFRS
Business revenue model
Featured in
Vol.2, Chapter 1 (as of 2026-09-20)
“How Prices and Supply Work in Japan's Semiconductor Industry”, Chapter 1: What Determines Orders for Chipmaking and Testing Equipment
Book’s reference date 2026-09-20 / data last checked 2026-10-20
The move that changed Advantest
It decided to bring in-house not only the tester itself but also the ability to supply the boards that connect the tester and the chip, through the acquisition of Shin Puu Technology Co., Ltd. of Taiwan.
On January 31, 2023, Advantest announced a definitive agreement to acquire Shin Puu of Taiwan, and the announcement stated that the deal would "expand the production base for high-end test boards." On April 28, 2023, it announced that "all acquisition procedures were completed on April 28 (Taiwan time)." The acquisition was made by its subsidiary R&D Altanova, Inc., with the aim of combining board design expertise with printed circuit board production and assembly capacity in Taiwan. The financial results release of April 2026 explains that sales of consumables such as test interface boards also increased in Services and Others, so the area expanded by the acquisition appears in the explanation of results in later years. The increase in Services and Others also includes maintenance and services, however, and the contribution of Shin Puu alone cannot be determined from the documents consulted.
Coverage in the book
- A Data Center Order Does Not Reach Japan's Equipment Makers Directly
- Advantest Splits into Test System and Services and Others
- More Chips to Test, or More Testing for Each Chip
- Advantest's Ten Fiscal Years, and Test System Sales
- In April 2023, It Completed the Acquisition of a Taiwanese Test Board Company
Related books, articles and videos
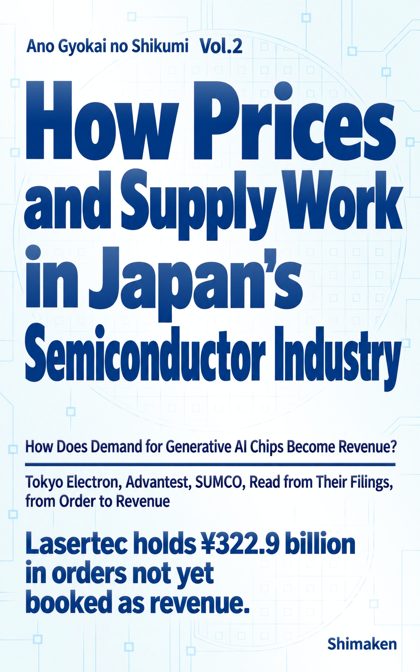 “How Prices and Supply Work in Japan's Semiconductor Industry”
Chapter 1: ADVANTEST
“What Determines Orders for Chipmaking and Testing Equipment”
“Ano Gyokai no Shikumi” series, Vol.2 — Kindle and paperback
Find it on Amazon →


Company profile
Tables scroll sideways
Disclosed data
Business activities and revenue composition
ADVANTEST
Revenue and profit by business segment
Period Apr 2025 to Mar 2026Source Annual securities reportsConsolidated・Disclosed
| Business | Net sales | Operating profit | |||||
|---|---|---|---|---|---|---|---|
| This year | Share | Last year | This year | Share | Margin | Last year | |
| テストシステム事業 | ¥1,019.4 billion | 90.3% | ¥682.8 billion | ¥518.8 billion | 98.3% | 50.9% | ¥262.1 billion |
| サービス他 | ¥109.2 billion | 9.7% | ¥96.9 billion | ¥8.8 billion | 1.7% | 8.0% | ¥-16.1 billion |
| Total of the businesses | ¥1,128.6 billion | 100.0% | ¥527.5 billion | 100.0% | |||
Revenue and profit
Amounts by account
| Group | Account | Amount | Consolidated / Non-consolidated |
|---|---|---|---|
| Selling, general and administrative expenses | Selling general and administrative expenses IFRS | ¥229.6 billion | Consolidated |
| Employee benefit expenses sgaifrs | ¥119.8 billion | Consolidated | |
| Other | ¥91.5 billion | Consolidated | |
| Research and development expenses | ¥77.5 billion | Parent only | |
| Business consignment expenses | ¥55.5 billion | Parent only | |
| Share-based payment expenses | ¥26.1 billion | Parent only | |
| Provision for product warranties | ¥22.4 billion | Parent only | |
| Depreciation and amortization | ¥18.4 billion | Consolidated | |
| Salaries | ¥6.1 billion | Parent only | |
| Depreciation | ¥0.7 billion | Parent only | |
| Profit by stage | Gross profit (loss) | ¥616.8 billion | Parent only |
| Operating income | ¥499.1 billion | Consolidated | |
| Ordinary income | ¥425.4 billion | Parent only | |
| Net income | ¥375.4 billion | Consolidated |
ADVANTEST
Selling, general and administrative expenses
Period Apr 2025 to Mar 2026Source Annual securities reports
- Selling general and administrative expenses IFRS ¥229.6 billion
- Employee benefit expenses sgaifrs ¥119.8 billion
- Other ¥91.5 billion
- Research and development expenses ¥77.5 billion
- Business consignment expenses ¥55.5 billion
- Share-based payment expenses ¥26.1 billion
Performance, financial position and capital allocation
Long-term changes in performance
ADVANTEST
Long-term revenue, profit and asset trends
Period 2013 to 2026Source Annual securities reportsDisclosed
Recent performance trends
Year-on-year comparison
| Item | 2022 | 2023 | 2024 | 2025 | 2026 |
|---|---|---|---|---|---|
| Revenue (IFRS) | ¥416.9B | ¥560.2B | ¥486.5B | ¥779.7B | ¥1,128.6B |
| Year on year (%) | +33.3%◆ | +34.4%◆ | -13.2% | +60.3%◆ | +44.7%◆ |
| Profit (loss) before tax (IFRS) | ¥116.3B | ¥171.3B | ¥78.2B | ¥224.8B | ¥516.7B |
| Change from prior year | +67.1% | +47.2% | -54.4% | +187.5% | +129.9% |
| Profit (loss) before tax (IFRS) as a share of Revenue (IFRS) | 27.9% | 30.6% | 16.1% | 28.8% | 45.8% |
| Change (percentage points) | +5.6 points◆ | +2.7 points◆ | -14.5 points◆ | +12.8 points◆ | +17.0 points◆ |
Fiscal periods marked for changes
Earlier fiscal periods (7)
- 2016Profit (loss) before tax (IFRS) as a share of revenue -5.4 points
- 2017Profit (loss) before tax (IFRS) as a share of revenue +2.4 points
- 2018Revenue (IFRS) year on year +32.9%, Profit (loss) before tax (IFRS) as a share of revenue +2.1 points
- 2019Revenue (IFRS) year on year +36.3%, Profit (loss) before tax (IFRS) as a share of revenue +11.7 points
- 2020Profit (loss) before tax (IFRS) as a share of revenue -2.2 points
- 2022Revenue (IFRS) year on year +33.3%, Profit (loss) before tax (IFRS) as a share of revenue +5.6 points
- 2023Revenue (IFRS) year on year +34.4%, Profit (loss) before tax (IFRS) as a share of revenue +2.7 points
- 2024Profit (loss) before tax (IFRS) as a share of revenue -14.5 points
- 2025Revenue (IFRS) year on year +60.3%, Profit (loss) before tax (IFRS) as a share of revenue +12.8 points
- 2026Revenue (IFRS) year on year +44.7%, Profit (loss) before tax (IFRS) as a share of revenue +17.0 points
ADVANTEST
Earnings and net assets per share over time
Unit yenSource Annual securities reports
Consolidated indicators (15 items)
| Item | 4 years ago | 3 years ago | 2 years ago | Last year | This year |
|---|---|---|---|---|---|
| Revenue (IFRS) | ¥416.9 billion | ¥560.2 billion | ¥486.5 billion | ¥779.7 billion | ¥1,128.6 billion |
| Profit (loss) before tax (IFRS) | ¥116.3 billion | ¥171.3 billion | ¥78.2 billion | ¥224.8 billion | ¥516.7 billion |
| Profit (loss) attributable to owners of parent (IFRS) | ¥87.3 billion | ¥130.4 billion | ¥62.3 billion | ¥161.2 billion | ¥375.4 billion |
| Comprehensive income attributable to owners of parent (IFRS) | ¥107.3 billion | ¥146.9 billion | ¥84.4 billion | ¥149.4 billion | ¥432.2 billion |
| Equity attributable to owners of parent (IFRS) | ¥294.6 billion | ¥368.7 billion | ¥431.2 billion | ¥506.5 billion | ¥795.7 billion |
| Total assets (IFRS) | ¥494.7 billion | ¥600.2 billion | ¥671.2 billion | ¥854.2 billion | ¥1,171.8 billion |
| Equity attributable to owners of parent per share (IFRS) | 1,551.72 yen | 500.61 yen | 584.25 yen | 690.8 yen | 1,097.5 yen |
| Basic earnings (loss) per share (IFRS) | 449.56 yen | 174.35 yen | 84.45 yen | 218.67 yen | 515.15 yen |
| Diluted earnings (loss) per share (IFRS) | 447.26 yen | 173.68 yen | 84.16 yen | 218.01 yen | 513.3 yen |
| Ratio of equity attributable to owners of parent (IFRS) | 59.6% | 61.4% | 64.2% | 59.3% | 67.9% |
| Return on equity attributable to owners of parent (IFRS) | 30.4% | 39.3% | 15.6% | 34.4% | 57.6% |
| Net cash provided by (used in) operating activities (IFRS) | ¥78.9 billion | ¥70.2 billion | ¥32.7 billion | ¥286.0 billion | ¥335.2 billion |
| Net cash provided by (used in) investing activities (IFRS) | ¥-46.9 billion | ¥-26.7 billion | ¥-27.9 billion | ¥-42.2 billion | ¥-34.6 billion |
| Net cash provided by (used in) financing activities (IFRS) | ¥-68.7 billion | ¥-77.4 billion | ¥10.8 billion | ¥-82.8 billion | ¥-230.6 billion |
| Cash and cash equivalents (IFRS) | ¥116.6 billion | ¥85.5 billion | ¥106.7 billion | ¥262.5 billion | ¥340.0 billion |
Parent only indicators (15 items)
| Item | 4 years ago | 3 years ago | 2 years ago | Last year | This year |
|---|---|---|---|---|---|
| Net sales | ¥355.6 billion | ¥482.6 billion | ¥394.7 billion | ¥673.1 billion | ¥988.2 billion |
| Ordinary income (loss) | ¥93.7 billion | ¥150.4 billion | ¥58.1 billion | ¥227.0 billion | ¥425.4 billion |
| Net income (loss) | ¥70.8 billion | ¥115.8 billion | ¥49.4 billion | ¥166.9 billion | ¥301.3 billion |
| Capital stock | ¥32.4 billion | ¥32.4 billion | ¥32.4 billion | ¥32.4 billion | ¥32.4 billion |
| Total number of issued shares (common stock) | 199,542,000 shares | 191,542,000 shares | 766,141,000 shares | 766,141,000 shares | 732,000,000 shares |
| Net assets | ¥262.9 billion | ¥306.0 billion | ¥332.6 billion | ¥426.7 billion | ¥583.4 billion |
| Total assets | ¥459.8 billion | ¥533.9 billion | ¥586.2 billion | ¥810.0 billion | ¥998.2 billion |
| Net assets per share | 1,380.85 yen | 414.65 yen | 450.14 yen | 581.37 yen | 804.15 yen |
| Dividend per share | 120 yen | 135 yen | Could not be retrieved | 39 yen | 59 yen |
| Interim dividend per share | 50 yen | 65 yen | 65 yen | 19 yen | 29 yen |
| Basic earnings (loss) per share | 364.61 yen | 154.81 yen | 66.93 yen | 226.24 yen | 413.29 yen |
| Diluted earnings per share | 363.54 yen | 154.45 yen | 66.8 yen | 225.77 yen | 412.51 yen |
| Equity-to-asset ratio | 57.0% | 57.2% | 56.7% | 52.7% | 58.4% |
| Return on equity | 25.9% | 40.8% | 15.5% | 44.0% | 59.7% |
| Payout ratio | 32.9% | 21.8% | 51.2% | 17.2% | 14.3% |
Dividend history
| Fiscal year | Annual dividend per share | Of which interim | Payout ratio (as reported, parent only) | Flag |
|---|---|---|---|---|
| FY ending 3/2026 | ¥59 | ¥29 | 14.3% | |
| FY ending 3/2025 | ¥39 | ¥19 | 17.2% | |
| FY 2024 | Could not be retrieved | Could not be retrieved | Could not be retrieved | |
| FY ending 3/2023 | ¥135 | ¥65 | 21.8% | |
| FY ending 3/2022 | ¥120 | ¥50 | 32.9% | |
| FY ending 3/2021 | ¥118 | ¥38 | 43.9% | |
| FY ending 3/2020 | ¥82 | ¥41 | 29.5% | |
| FY ending 3/2019 | ¥92 | ¥50 | 35.9% | |
| FY ending 3/2018 | ¥32 | ¥9 | 21.6% | |
| FY ending 3/2017 | ¥25 | ¥13 | 28.7% | |
| FY ending 3/2016 | ¥20 | ¥10 | 49.4% | |
| FY ending 3/2015 | ¥15 | ¥5 | 20.7% | |
| FY ending 3/2014 | ¥15 | ¥10 | Could not be retrieved | |
| FY ending 3/2013 | ¥20 | ¥10 | 458.7% |
ADVANTEST
Dividends per share over time
Unit yenSource Annual securities reports
Research and development expenses and capital expenditure
| Fiscal year | Research and development | Capital expenditure |
|---|---|---|
| FY ending 3/2026 | ¥78.1 billion | ¥34.3 billion |
| FY ending 3/2025 | ¥71.4 billion | Could not be retrieved |
| FY ending 3/2021 | ¥42.7 billion | ¥13.7 billion |
| FY ending 3/2020 | ¥40.1 billion | Could not be retrieved |
Revenue scale in the same industry
ADVANTEST
Source Annual securities reports of each company
Electric Appliances: 239 companies · revenue · largest first・each company’s latest fiscal year・Consolidated・Disclosed
- 1 SONY GROUPFY Mar 2026 ¥12.5T
- 2 HitachiFY Mar 2026 ¥10.6T
- 3 PanasonicFY Mar 2026 ¥8.0T
- … 15 companies
- 19 FUJI ELECTRICFY Mar 2026 ¥1.2T
- 20 KEYENCEFY Mar 2026 ¥1.2T
- 21 ADVANTESTThis companyFY Mar 2026 ¥1.1T
- 22 KONICA MINOLTAFY Mar 2026 ¥1.1T
- 23 ALPS ALPINEFY Mar 2026 ¥1.0T
- … 216 companies
Workforce information
Women 17.4 yrs Average length of service by gender
Administrative filings and published information
Workplace information filings
| Item | Value |
|---|---|
| Employees | 2,473 |
| Average monthly overtime (statutory overtime plus work on statutory days off) |
21.2 hours |
| Annual paid leave taken |
81.2% |
| Childcare leave taken, men |
60% |
| Childcare leave taken, women |
100% |
| Share of managers who are women | 4.5% |
| Share of board members who are women | 11.4% |
Greenhouse gas emissions
| Category | Emissions |
|---|---|
| 特定事業所排出者 | 19,852 t-CO2 |
| Sites covered by the report | 4 |
Audit and disclosure information
| Item | Value |
|---|---|
| Audit firm | EY新日本有限責任監査法人 |
| Audit fees (this year, total) | ¥0.2 billion |
| Non-audit fees (this year, total) | ¥24.00 million |
| Audit fees (this year, network firms) | ¥0.2 billion |
| Non-audit fees (this year, network firms) | ¥0.2 billion |
| Going concern note | Cannot be determined |
| Accounting standard | IFRS |
Sources and methodology
Retrieved disclosed figures
Major management indicators (5 years) (30 items)
| Item | Value | Consolidated / Non-consolidated |
|---|---|---|
| Net cash provided by (used in) operating activities (IFRS) | ¥335.2 billion | Consolidated |
| Basic earnings (loss) per share (IFRS) | 515.15 yen | Consolidated |
| Revenue (IFRS) | ¥1,128.6 billion | Consolidated |
| Diluted earnings (loss) per share (IFRS) | 513.3 yen | Consolidated |
| Profit (loss) attributable to owners of parent (IFRS) | ¥375.4 billion | Consolidated |
| Comprehensive income attributable to owners of parent (IFRS) | ¥432.2 billion | Consolidated |
| Net cash provided by (used in) investing activities (IFRS) | ¥-34.6 billion | Consolidated |
| Cash and cash equivalents (IFRS) | ¥340.0 billion | Consolidated |
| Profit (loss) before tax (IFRS) | ¥516.7 billion | Consolidated |
| Total assets (IFRS) | ¥1,171.8 billion | Consolidated |
| Equity attributable to owners of parent (IFRS) | ¥795.7 billion | Consolidated |
| Return on equity attributable to owners of parent (IFRS) | 57.6% | Consolidated |
| Ratio of equity attributable to owners of parent (IFRS) | 67.9% | Consolidated |
| Net cash provided by (used in) financing activities (IFRS) | ¥-230.6 billion | Consolidated |
| Equity attributable to owners of parent per share (IFRS) | 1,097.5 yen | Consolidated |
| Dividend per share | 59 yen | Parent only |
| Net sales | ¥988.2 billion | Parent only |
| Net income (loss) | ¥301.3 billion | Parent only |
| Diluted earnings per share | 412.51 yen | Parent only |
| Total number of issued shares (common stock) | 732,000,000 shares | Parent only |
| Net assets | ¥583.4 billion | Parent only |
| Ordinary income (loss) | ¥425.4 billion | Parent only |
| Total assets | ¥998.2 billion | Parent only |
| Return on equity | 59.7% | Parent only |
| Equity-to-asset ratio | 58.4% | Parent only |
| Capital stock | ¥32.4 billion | Parent only |
| Payout ratio | 14.3% | Parent only |
| Interim dividend per share | 29 yen | Parent only |
| Basic earnings (loss) per share | 413.29 yen | Parent only |
| Net assets per share | 804.15 yen | Parent only |
Employees (11 items)
| Item | Value | Consolidated / Non-consolidated |
|---|---|---|
| Number of employees | 7,241 people | Consolidated |
| Number of employees | 7,241 people | Consolidated |
| Wage gap between men and women (all employees) | 72.2% | Parent only |
| Average length of service (years) | 20.16 years | Parent only |
| Average annual salary | ¥10.98 million | Parent only |
| Average age (years) | 45.68 years old | Parent only |
| Number of employees | 2,033 people | Parent only |
| Number of employees | 2,033 people | Parent only |
| Number of employees | 2,033 people | Parent only |
| Wage gap between men and women (regular employees) | 74.1% | Parent only |
| Wage gap between men and women (non-regular employees) | 55.9% | Parent only |
Other disclosed items (8 items)
| Item | Value | Consolidated / Non-consolidated |
|---|---|---|
| Average number of temporary employees | 389 people | Consolidated |
| Average number of temporary employees | 389 people | Consolidated |
| Rate of male employees taking childcare leave (all employees) | 60.0% | Parent only |
| Average number of temporary employees | 290 people | Parent only |
| Average number of temporary employees | 290 people | Parent only |
| Average number of temporary employees | 290 people | Parent only |
| Total return on the share price index | 202.2% | Parent only |
| Ratio of female employees in managerial positions | 4.5% | Parent only |
Shares (5 items)
| Item | Value | Consolidated / Non-consolidated |
|---|---|---|
| Carrying amount on the balance sheet | ¥0.2 billion | Consolidated |
| Carrying amount on the balance sheet | ¥1.4 billion | Consolidated |
| Number of issues | 6 issues | Consolidated |
| Number of issues | 1 issues | Consolidated |
| Total shareholder return | 848.2% | Parent only |
Research and development (1 items)
| Item | Value | Consolidated / Non-consolidated |
|---|---|---|
| Research and development expenses | ¥78.1 billion | Consolidated |
Property and facilities (1 items)
| Item | Value | Consolidated / Non-consolidated |
|---|---|---|
| Capital expenditures | ¥34.3 billion | Consolidated |
Audit (9 items)
| Item | Value | Consolidated / Non-consolidated |
|---|---|---|
| Fees for audit and attestation services - reporting company | ¥0.2 billion | Consolidated |
| Fees for audit and attestation services - total | ¥0.2 billion | Consolidated |
| Fees for audit and attestation services - total | ¥0.2 billion | Consolidated |
| Fees for audit and attestation services - consolidated subsidiaries | ¥0.2 billion | Consolidated |
| Fees for non-audit services - reporting company | ¥18.00 million | Consolidated |
| Fees for non-audit services - reporting company | ¥24.00 million | Consolidated |
| Fees for non-audit services - total | ¥0.2 billion | Consolidated |
| Fees for non-audit services - total | ¥24.00 million | Consolidated |
| Non audit fees consolidated subsidiaries network firms | ¥0.2 billion | Consolidated |
Accounts unique to this company (14 items)
| Item | Value | Consolidated / Non-consolidated |
|---|---|---|
| Revenue | 240 | Consolidated |
| Revenue | 2 | Consolidated |
| Revenue | ¥3.1 billion | Consolidated |
| Revenue | ¥9.7 billion | Consolidated |
| Revenue | ¥-75.4 billion | Consolidated |
| Revenue | ¥4.5 billion | Consolidated |
| Revenue | ¥53.2 billion | Consolidated |
| Revenue | ¥-40.7 billion | Consolidated |
| Revenue | ¥12.5 billion | Consolidated |
| Revenue | ¥17.3 billion | Consolidated |
| Revenue | ¥2.5 billion | Consolidated |
| Revenue | 45 | Parent only |
| Revenue | 15 | Parent only |
| Change in average annual salary from the previous year | 4.6% | Parent only |
Balance sheet (122 items)
| Item | Value | Consolidated / Non-consolidated |
|---|---|---|
| Other | ¥-0.6 billion | Consolidated |
| Other | ¥0.9 billion | Consolidated |
| Other | ¥0.3 billion | Consolidated |
| Other current liabilities clifrs | ¥42.8 billion | Consolidated |
| Other current assets caifrs | ¥36.0 billion | Consolidated |
| Other components of equity IFRS | ¥99.7 billion | Consolidated |
| Other financial liabilities | ¥12.5 billion | Consolidated |
| Other financial assets | ¥71.9 billion | Consolidated |
| Other non current liabilities nclifrs | ¥3.9 billion | Consolidated |
| Other non current assets ncaifrs | ¥1.9 billion | Consolidated |
| Goodwill | ¥82.0 billion | Consolidated |
| Goodwill | ¥-16.3 billion | Consolidated |
| Goodwill and intangible assets accumulated amortization and impairment losses IFRS | ¥-67.2 billion | Consolidated |
| Goodwill and intangible assets acquisition cost IFRS | ¥151.5 billion | Consolidated |
| Goodwill and intangible assets IFRS | ¥84.2 billion | Consolidated |
| Goodwill and intangible assets IFRS | ¥84.2 billion | Consolidated |
| Goodwill IFRS | ¥65.7 billion | Consolidated |
| Software | ¥-9.5 billion | Consolidated |
| Software | ¥15.3 billion | Consolidated |
| Software IFRS | ¥5.8 billion | Consolidated |
| Lease obligations | ¥5.0 billion | Consolidated |
| Lease obligations | ¥15.2 billion | Consolidated |
| Work in process | ¥69.2 billion | Consolidated |
| Right of use assets IFRS | ¥19.9 billion | Consolidated |
| Retained earnings IFRS | ¥655.6 billion | Consolidated |
| Raw materials and supplies | ¥127.2 billion | Consolidated |
| Trade and other payables clifrs | ¥142.1 billion | Consolidated |
| Trade and other receivables caifrs | ¥228.7 billion | Consolidated |
| Land | ¥20.9 billion | Consolidated |
| Land | ¥-1.1 billion | Consolidated |
| Land IFRS | ¥19.8 billion | Consolidated |
| Tools, furniture and fixtures | ¥15.4 billion | Consolidated |
| Tools, furniture and fixtures | ¥-10.2 billion | Consolidated |
| Tools, furniture and fixtures | ¥5.2 billion | Consolidated |
| Buildings | ¥60.5 billion | Consolidated |
| Buildings | ¥-33.1 billion | Consolidated |
| Buildings IFRS | ¥27.4 billion | Consolidated |
| Construction in progress | ¥8.7 billion | Consolidated |
| Construction in progress IFRS | ¥8.7 billion | Consolidated |
| Provisions clifrs | ¥15.5 billion | Consolidated |
| Property, plant and equipment | ¥225.9 billion | Consolidated |
| Property, plant and equipment | ¥-124.2 billion | Consolidated |
| Property plant and equipment IFRS | ¥101.6 billion | Consolidated |
| Property plant and equipment IFRS | ¥101.6 billion | Consolidated |
| Income taxes payable | ¥112.5 billion | Consolidated |
| Inventories | ¥231.7 billion | Consolidated |
| Inventories | ¥231.7 billion | Consolidated |
| Machinery, equipment | ¥120.4 billion | Consolidated |
| Machinery, equipment | ¥-79.9 billion | Consolidated |
| Machinery and equipment IFRS | ¥40.5 billion | Consolidated |
| Total current liabilities IFRS | ¥330.3 billion | Consolidated |
| Current assets IFRS | ¥836.4 billion | Consolidated |
| Cash and cash equivalents (IFRS) | ¥340.0 billion | Consolidated |
| Cash and cash equivalents (IFRS) | ¥340.0 billion | Consolidated |
| Net assets | ¥795.7 billion | Consolidated |
| Net assets | ¥795.7 billion | Consolidated |
| Total assets | ¥1,171.8 billion | Consolidated |
| Deferred tax liabilities IFRS | ¥6.4 billion | Consolidated |
| Deferred tax assets IFRS | ¥55.8 billion | Consolidated |
| Treasury shares IFRS | ¥-44.4 billion | Consolidated |
| Finished goods | ¥35.2 billion | Consolidated |
| Equity attributable to owners of parent (IFRS) | ¥795.7 billion | Consolidated |
| Liabilities and equity IFRS | ¥1,171.8 billion | Consolidated |
| Liabilities IFRS | ¥376.1 billion | Consolidated |
| Capital surplus IFRS | ¥52.5 billion | Consolidated |
| Share capital IFRS | ¥32.4 billion | Consolidated |
| Net defined benefit liability | ¥20.2 billion | Consolidated |
| Non current labilities IFRS | ¥45.8 billion | Consolidated |
| Non current assets IFRS | ¥335.4 billion | Consolidated |
| Other | ¥0.7 billion | Parent only |
| Other | ¥9.3 billion | Parent only |
| Other | ¥10.4 billion | Parent only |
| Other | ¥21.9 billion | Parent only |
| Other | ¥3.4 billion | Parent only |
| Valuation difference on available-for-sale securities | ¥0.8 billion | Parent only |
| Other, net | ¥11.0 billion | Parent only |
| Work in process | ¥54.9 billion | Parent only |
| Retained earnings | ¥561.7 billion | Parent only |
| Legal retained earnings | ¥3.1 billion | Parent only |
| Advances received | ¥19.2 billion | Parent only |
| Raw materials and supplies | ¥98.4 billion | Parent only |
| Merchandise and finished goods | ¥25.4 billion | Parent only |
| Non-current liabilities | ¥32.0 billion | Parent only |
| Non-current assets | ¥282.6 billion | Parent only |
| Land | ¥8.1 billion | Parent only |
| Accounts receivable - trade | ¥224.0 billion | Parent only |
| Buildings and structures, net | ¥6.1 billion | Parent only |
| Provision for directors' bonuses | ¥0.4 billion | Parent only |
| Investments and other assets | ¥254.1 billion | Parent only |
| Investment securities | ¥1.6 billion | Parent only |
| Property, plant and equipment | ¥25.1 billion | Parent only |
| Income taxes payable | ¥101.5 billion | Parent only |
| Accrued expenses | ¥13.7 billion | Parent only |
| Accounts payable - other | ¥20.6 billion | Parent only |
| Shareholders' equity | ¥582.7 billion | Parent only |
| Provision for stocks payment-NCL | ¥20.1 billion | Parent only |
| Provision for stocks payment | ¥8.5 billion | Parent only |
| Current liabilities | ¥382.8 billion | Parent only |
| Current assets | ¥715.6 billion | Parent only |
| Accumulated depreciation | ¥-34.0 billion | Parent only |
| Intangible assets | ¥3.4 billion | Parent only |
| Cash and deposits | ¥286.7 billion | Parent only |
| Net assets | ¥583.4 billion | Parent only |
| Net assets | ¥583.4 billion | Parent only |
| Total assets | ¥998.2 billion | Parent only |
| Deferred tax assets | ¥36.1 billion | Parent only |
| Retained earnings brought forward | ¥558.6 billion | Parent only |
| Treasury stock | ¥-44.4 billion | Parent only |
| Provision for product warranties | ¥15.6 billion | Parent only |
| Valuation and translation adjustments | ¥0.8 billion | Parent only |
| Liabilities | ¥414.7 billion | Parent only |
| Liabilities and net assets | ¥998.2 billion | Parent only |
| Accounts payable - trade | ¥87.5 billion | Parent only |
| Capital surplus | ¥33.0 billion | Parent only |
| Legal capital surplus | ¥33.0 billion | Parent only |
| Capital stock | ¥32.4 billion | Parent only |
| Asset retirement obligations | ¥43.00 million | Parent only |
| Provision for retirement benefits | ¥11.2 billion | Parent only |
| Long-term loans receivable | ¥8.0 billion | Parent only |
| Shares of subsidiaries and associates | ¥199.0 billion | Parent only |
| Electronically recorded monetary claims - operating | ¥4.2 billion | Parent only |
| Deposits received | ¥105.5 billion | Parent only |
Statement of income (91 items)
| Item | Value | Consolidated / Non-consolidated |
|---|---|---|
| Other | ¥1.0 billion | Consolidated |
| Other | ¥0.9 billion | Consolidated |
| Other | ¥2.2 billion | Consolidated |
| Other | ¥91.5 billion | Consolidated |
| Other | ¥0.5 billion | Consolidated |
| Net change in fair value of equity instruments designated as measured at fair value through other comprehensive income net of tax items that will not be reclassified to profit or loss ociifrs | ¥33.2 billion | Consolidated |
| Financial assets measured at fair value through other comprehensive income | ¥0.1 billion | Consolidated |
| Other comprehensive income IFRS | ¥56.9 billion | Consolidated |
| Other comprehensive income IFRS | ¥56.9 billion | Consolidated |
| Other income IFRS | ¥3.6 billion | Consolidated |
| Other income IFRS | ¥3.6 billion | Consolidated |
| Other expenses IFRS | ¥0.9 billion | Consolidated |
| Other expenses IFRS | ¥0.9 billion | Consolidated |
| Segment profit loss IFRS | ¥503.6 billion | Consolidated |
| Financial liabilities measured at amortized cost | ¥1.3 billion | Consolidated |
| Financial assets measured at amortized cost | ¥2.9 billion | Consolidated |
| Operating income | ¥499.1 billion | Consolidated |
| Operating income | ¥499.1 billion | Consolidated |
| Net cash provided by (used in) operating activities | ¥335.2 billion | Consolidated |
| Exchange differences on translation of foreign operations net of tax items that may be reclassified to profit or loss ociifrs | ¥24.7 billion | Consolidated |
| Basic earnings loss per share IFRS | 515.15 yen | Consolidated |
| Cost of sales IFRS | ¥402.5 billion | Consolidated |
| Gross profit IFRS | ¥726.1 billion | Consolidated |
| Net sales | ¥1,128.6 billion | Consolidated |
| Net sales | ¥1,128.6 billion | Consolidated |
| Sales to external customers IFRS | ¥1,128.6 billion | Consolidated |
| Diluted earnings loss per share IFRS | 513.3 yen | Consolidated |
| Profit loss IFRS | ¥375.4 billion | Consolidated |
| Profit loss IFRS | ¥375.4 billion | Consolidated |
| Profit loss IFRS | ¥375.4 billion | Consolidated |
| Comprehensive income (IFRS) | ¥432.2 billion | Consolidated |
| Comprehensive income (IFRS) | ¥432.2 billion | Consolidated |
| Net income | ¥375.4 billion | Consolidated |
| Employee benefit expenses sgaifrs | ¥119.8 billion | Consolidated |
| Total transactions with owners IFRS | ¥-143.0 billion | Consolidated |
| Net cash provided by (used in) investing activities (IFRS) | ¥-34.6 billion | Consolidated |
| Share-based payment transactions | ¥4.4 billion | Consolidated |
| Income tax expense IFRS | ¥141.4 billion | Consolidated |
| Depreciation and amortization | ¥25.6 billion | Consolidated |
| Depreciation and amortization | ¥18.4 billion | Consolidated |
| Foreign exchange gain IFRS | ¥56.00 million | Consolidated |
| Net increase decrease in cash and cash equivalents IFRS | ¥77.4 billion | Consolidated |
| Effect of exchange rate changes on cash and cash equivalents IFRS | ¥7.3 billion | Consolidated |
| Remeasurements of defined benefit plans net of tax items that will not be reclassified to profit or loss ociifrs | ¥-1.0 billion | Consolidated |
| Financial liabilities measured at fair value through profit or loss | ¥1.0 billion | Consolidated |
| Profit loss before tax IFRS | ¥516.7 billion | Consolidated |
| Profit loss before tax IFRS | ¥516.7 billion | Consolidated |
| Profit loss before tax IFRS | ¥516.7 billion | Consolidated |
| Disposal of treasury stock | ¥0.4 billion | Consolidated |
| Purchase of treasury stock | ¥-114.3 billion | Consolidated |
| Comprehensive income attributable to owners of parent IFRS | ¥432.2 billion | Consolidated |
| Net cash provided by (used in) financing activities (IFRS) | ¥-230.6 billion | Consolidated |
| Selling general and administrative expenses IFRS | ¥229.6 billion | Consolidated |
| Selling general and administrative expenses IFRS | ¥229.6 billion | Consolidated |
| Dividendsofsurplus | ¥-35.8 billion | Consolidated |
| Finance income IFRS | ¥20.4 billion | Consolidated |
| Finance income IFRS | ¥20.4 billion | Consolidated |
| Finance income IFRS | ¥20.4 billion | Consolidated |
| Finance costs IFRS | ¥2.8 billion | Consolidated |
| Finance costs IFRS | ¥2.8 billion | Consolidated |
| Finance costs IFRS | ¥2.8 billion | Consolidated |
| Other | ¥2.6 billion | Parent only |
| Other | ¥0.7 billion | Parent only |
| Other | ¥22.5 billion | Parent only |
| Dividends from surplus | ¥-35.8 billion | Parent only |
| Interest and dividend income | ¥19.4 billion | Parent only |
| Operating income | ¥405.9 billion | Parent only |
| Non-operating income | ¥24.4 billion | Parent only |
| Non-operating expenses | ¥4.9 billion | Parent only |
| Cost of sales | ¥371.5 billion | Parent only |
| Gross profit (loss) | ¥616.8 billion | Parent only |
| Net sales | ¥988.2 billion | Parent only |
| Net income (loss) | ¥301.3 billion | Parent only |
| Net income (loss) | ¥301.3 billion | Parent only |
| Interest expenses | ¥4.3 billion | Parent only |
| Share-based payment expenses | ¥26.1 billion | Parent only |
| Business consignment expenses | ¥55.5 billion | Parent only |
| Income taxes - current | ¥131.5 billion | Parent only |
| Income taxes | ¥124.0 billion | Parent only |
| Income taxes - deferred | ¥-7.4 billion | Parent only |
| Depreciation | ¥0.7 billion | Parent only |
| Foreign exchange gains | ¥2.5 billion | Parent only |
| Research and development expenses | ¥77.5 billion | Parent only |
| Income (loss) before income taxes | ¥425.4 billion | Parent only |
| Ordinary income | ¥425.4 billion | Parent only |
| Salaries | ¥6.1 billion | Parent only |
| Disposal of treasury stock | ¥4.7 billion | Parent only |
| Purchase of treasury stock | ¥-114.2 billion | Parent only |
| Provision for product warranties | ¥22.4 billion | Parent only |
| Selling, general and administrative expenses | ¥210.9 billion | Parent only |
| Selling, general and administrative expenses | ¥210.9 billion | Parent only |
Statement of cash flows (21 items)
| Item | Value | Consolidated / Non-consolidated |
|---|---|---|
| Other | ¥-1.4 billion | Consolidated |
| Other | ¥-0.5 billion | Consolidated |
| Other | ¥-21.9 billion | Consolidated |
| Repayments of lease obligations | ¥-5.0 billion | Consolidated |
| Proceeds from sale of businesses inv cfifrs | ¥2.9 billion | Consolidated |
| Interest paid ope cfifrs | ¥-2.4 billion | Consolidated |
| Interest and dividends received ope cfifrs | ¥3.0 billion | Consolidated |
| Increase (decrease) in trade and other payables | ¥31.9 billion | Consolidated |
| Decrease (increase) in trade and other receivables | ¥-105.9 billion | Consolidated |
| Subtotal | ¥445.4 billion | Consolidated |
| Purchase of property plant and equipment inv cfifrs | ¥-33.0 billion | Consolidated |
| Proceeds from sale of property plant and equipment inv cfifrs | ¥8.00 million | Consolidated |
| Share-based payment expenses | ¥4.5 billion | Consolidated |
| Decrease (increase) in inventories | ¥-18.5 billion | Consolidated |
| Income taxes refund (paid) | ¥-110.8 billion | Consolidated |
| Depreciation and amortization | ¥25.6 billion | Consolidated |
| Purchase of intangible assets inv cfifrs | ¥-3.0 billion | Consolidated |
| Regarding purchase of treasury stock | ¥-114.3 billion | Consolidated |
| Proceeds from sale of treasury shares fin cfifrs | ¥0.4 billion | Consolidated |
| Increase (decrease) in net defined benefit liability | ¥0.2 billion | Consolidated |
| Dividends | ¥-35.8 billion | Consolidated |
Statement of changes in equity (2 items)
| Item | Value | Consolidated / Non-consolidated |
|---|---|---|
| Total changes during the period | ¥156.7 billion | Parent only |
| Net changes in items other than shareholders' equity | ¥0.7 billion | Parent only |
Basic indicators
| Item | Value | Consolidated / Non-consolidated | Source |
|---|---|---|---|
| Net cash provided by (used in) operating activities | ¥335.2 billion | Consolidated | Disclosed |
| Dividend per share | 59 | Parent only | Disclosed |
| Number of employees | 7,241 | Consolidated | Disclosed |
| Net assets | ¥795.7 billion | Consolidated | Disclosed |
| Net sales | ¥1,128.6 billion | Consolidated | Disclosed |
| Operating income | ¥499.1 billion | Consolidated | Disclosed |
| Ordinary income | ¥425.4 billion | Parent only | Disclosed |
| Net income | ¥375.4 billion | Consolidated | Disclosed |
| Total assets | ¥1,171.8 billion | Consolidated | Disclosed |
| Operating margin | 44.2% | Consolidated | Calculated |
| Net margin | 33.3% | Consolidated | Calculated |
| Sales per employee | 155863831 yen | Consolidated | Calculated |
| Total asset turnover | 0.96 times | Consolidated | Calculated |
| Net assets to total assets | 67.9% | Consolidated | Calculated |