MANDARAKE
MANDARAKE INC.
Company highlights
The largest holder on the register is 古 川 益 蔵, at 34.0%.
Key figures
Period Oct 2024 to Sep 2025Parent onlyJapanese GAAP
Company profile
Tables scroll sideways
Disclosed data
Business activities and revenue composition
Revenue and profit by business segment
Disclosed segments (business divisions used in reporting): one
MANDARAKE
Revenue breakdown
Period Oct 2024 to Sep 2025Source Annual securities reports
- Merchandize sales ¥15.1 billion
- Product sales revenue ¥0.1 billion
Revenue and profit
MANDARAKE
Period Oct 2024 to Sep 2025Source Annual securities reports
Amounts by account
| Group | Account | Amount | Consolidated / Non-consolidated |
|---|---|---|---|
| Revenue breakdown | Merchandize sales | ¥15.1 billion | Parent only |
| Product sales revenue | ¥66.94 million | Parent only | |
| Selling, general and administrative expenses | Salaries and bonuses | ¥2.0 billion | Parent only |
| Other | ¥1.3 billion | Parent only | |
| Other salaries | ¥1.0 billion | Parent only | |
| Rent expenses | ¥0.7 billion | Parent only | |
| Legal welfare expenses | ¥0.5 billion | Parent only | |
| Depreciation | ¥0.2 billion | Parent only | |
| Provision for directors' retirement benefits | ¥0.2 billion | Parent only | |
| Directors' compensations | ¥0.2 billion | Parent only | |
| Supplies expenses | ¥0.1 billion | Parent only | |
| Taxes and dues | ¥0.1 billion | Parent only | |
| Welfare expenses | ¥0.1 billion | Parent only | |
| Provision for bonuses | ¥97.46 million | Parent only | |
| Retirement benefit expenses | ¥-92.63 million | Parent only | |
| Provision for shareholder benefit program | ¥63.81 million | Parent only | |
| Profit by stage | Gross profit (loss) | ¥8.3 billion | Parent only |
| Operating income | ¥1.8 billion | Parent only | |
| Ordinary income | ¥1.8 billion | Parent only |
MANDARAKE
Selling, general and administrative expenses
Period Oct 2024 to Sep 2025Source Annual securities reports
- Salaries and bonuses ¥2.0 billion
- Other ¥1.3 billion
- Other salaries ¥1.0 billion
- Rent expenses ¥0.7 billion
- Legal welfare expenses ¥0.5 billion
- Depreciation ¥0.2 billion
- Other (not itemized) ¥0.9 billion
Performance, financial position and capital allocation
Long-term changes in performance
MANDARAKE
Long-term revenue, profit and asset trends
Period 2012 to 2025Source Annual securities reportsDisclosed
MANDARAKE
Recent performance trends
Source Annual securities reports
Year-on-year comparison
| Item | 2021 | 2022 | 2023 | 2024 | 2025 |
|---|---|---|---|---|---|
| Net sales | ¥9.6B | ¥10.6B | ¥12.8B | ¥14.5B | ¥15.2B |
| Year on year (%) | +6.7% | +10.0% | +21.3%◆ | +12.6% | +5.0% |
| Ordinary income (loss) | ¥0.6B | ¥0.9B | ¥1.9B | ¥2.1B | ¥1.8B |
| Change from prior year | +131.0% | +59.6% | +104.5% | +10.9% | -14.8% |
| Ordinary income (loss) as a share of Net sales | 5.9% | 8.6% | 14.4% | 14.2% | 11.5% |
| Change (percentage points) | +3.2 points◆ | +2.7 points◆ | +5.9 points◆ | -0.2 points | -2.7 points◆ |
Fiscal periods marked for changes
Earlier fiscal periods (4)
- 2013Ordinary income (loss) as a share of revenue +3.5 points
- 2016Ordinary income (loss) as a share of revenue -4.4 points
- 2020Ordinary income (loss) as a share of revenue -5.7 points
- 2021Ordinary income (loss) as a share of revenue +3.2 points
- 2022Ordinary income (loss) as a share of revenue +2.7 points
- 2023Net sales year on year +21.3%, Ordinary income (loss) as a share of revenue +5.9 points
- 2025Ordinary income (loss) as a share of revenue -2.7 points
MANDARAKE
Earnings and net assets per share over time
Unit yenSource Annual securities reports
MANDARAKE
Return on equity over time
Unit %Source Annual securities reports
Parent only indicators (17 items)
| Item | 4 years ago | 3 years ago | 2 years ago | Last year | This year |
|---|---|---|---|---|---|
| Net sales | ¥9.6 billion | ¥10.6 billion | ¥12.8 billion | ¥14.5 billion | ¥15.2 billion |
| Ordinary income (loss) | ¥0.6 billion | ¥0.9 billion | ¥1.9 billion | ¥2.1 billion | ¥1.8 billion |
| Net income (loss) | ¥0.4 billion | ¥0.6 billion | ¥1.2 billion | ¥1.4 billion | ¥1.1 billion |
| Capital stock | ¥0.8 billion | ¥0.8 billion | ¥0.8 billion | ¥0.8 billion | ¥0.8 billion |
| Total number of issued shares (common stock) | 7,236,000 shares | 7,236,000 shares | 7,236,000 shares | 36,180,000 shares | 36,180,000 shares |
| Net assets | ¥7.8 billion | ¥8.4 billion | ¥9.6 billion | ¥10.9 billion | ¥11.8 billion |
| Total assets | ¥16.1 billion | ¥16.7 billion | ¥17.9 billion | ¥18.1 billion | ¥18.9 billion |
| Net assets per share | 235.28 yen | 252.82 yen | 290.32 yen | 330.51 yen | 364.95 yen |
| Dividend per share | 1 yen | 1 yen | 1 yen | 1 yen | 1 yen |
| Basic earnings (loss) per share | 10.79 yen | 17.74 yen | 37.69 yen | 41.75 yen | 34.36 yen |
| Equity-to-asset ratio | 48.3% | 50.2% | 53.7% | 60.1% | 62.5% |
| Return on equity | 4.7% | 7.3% | 13.9% | 13.4% | 9.9% |
| Payout ratio | 1.8% | 1.1% | 0.5% | 2.4% | 2.9% |
| Net cash provided by (used in) operating activities | ¥0.4 billion | ¥0.6 billion | ¥1.2 billion | ¥1.1 billion | ¥0.2 billion |
| Net cash provided by (used in) investing activities | ¥-0.1 billion | ¥-0.1 billion | ¥-0.3 billion | ¥-90.50 million | ¥-0.4 billion |
| Net cash provided by (used in) financing activities | ¥-0.3 billion | ¥-0.3 billion | ¥-0.3 billion | ¥-1.2 billion | ¥-0.3 billion |
| Cash and cash equivalents | ¥0.7 billion | ¥0.8 billion | ¥1.5 billion | ¥1.3 billion | ¥0.8 billion |
Dividend history
| Fiscal year | Annual dividend per share | Of which interim | Payout ratio (as reported, parent only) | Flag |
|---|---|---|---|---|
| FY ending 9/2025 | ¥1 | Could not be retrieved | 2.9% | |
| FY ending 9/2024 | ¥1 | Could not be retrieved | 2.4% | Stock split or share consolidation noted |
| FY ending 9/2023 | ¥1 | Could not be retrieved | 0.5% | |
| FY ending 9/2022 | ¥1 | Could not be retrieved | 1.1% | |
| FY ending 9/2021 | ¥1 | Could not be retrieved | 1.8% | |
| FY ending 9/2020 | ¥1 | Could not be retrieved | 4.8% | |
| FY ending 9/2019 | ¥1 | Could not be retrieved | 1.2% | |
| FY ending 9/2018 | ¥1 | Could not be retrieved | 1.6% | |
| FY ending 9/2017 | ¥1 | Could not be retrieved | 1.6% | |
| FY ending 9/2016 | ¥1 | Could not be retrieved | 1.8% | |
| FY ending 9/2015 | ¥1 | Could not be retrieved | 1.1% | Stock split or share consolidation noted |
| FY ending 9/2014 | ¥5 | Could not be retrieved | 0.8% | |
| FY ending 9/2013 | ¥5 | Could not be retrieved | 0.8% | |
| FY ending 9/2012 | ¥5 | Could not be retrieved | 1.6% |
MANDARAKE
Dividends per share over time
Unit yenSource Annual securities reports
Shareholder composition
Share ownership by holder category
MANDARAKE
Unit %Source Annual securities reports
- Financial institutions1.69%
- Securities firms0.90%
- Other corporations4.72%
- Foreign holders (institutions)1.71%
- Foreign holders (individuals)0.11%
- Individuals and others90.87%
Major shareholders
| Rank | Shareholder | Shareholding ratio | Shares held |
|---|---|---|---|
| 1 | 古 川 益 蔵 | 33.97% | 11,004,000 |
| 2 | 有限会社カイカイキキ | 3.54% | 1,148,000 |
| 3 | まんだらけ従業員持株会 | 1.93% | 625,000 |
| 4 | 西 田 貴 美 | 1.7% | 550,000 |
| 5 | 古 川 北 斗 | 1.27% | 412,000 |
| 6 | 大 軒 紀 之 | 1.13% | 367,000 |
| 7 | 株式会社日本カストディ銀行(信託口) | 1.1% | 355,000 |
| 8 | 古 川 せ お に | 0.99% | 322,000 |
| 9 | 古 川 五 勢 | 0.99% | 322,000 |
| 10 | まんだらけ役員持株会 | 0.8% | 257,000 |
Research and development expenses and capital expenditure
| Fiscal year | Capital expenditure |
|---|---|
| FY ending 9/2025 | ¥0.3 billion |
| FY ending 9/2020 | ¥0.1 billion |
Revenue scale in the same industry
MANDARAKE
Source Annual securities reports of each company
Retail Trade: 343 companies · revenue · largest first・each company’s latest fiscal year・consolidated (parent-only where no consolidated figures)・Disclosed
Workforce information
Audit and disclosure information
| Item | Value |
|---|---|
| Audit firm | UHY東京監査法人 |
| Audit fees (this year, filing company) | ¥14.00 million |
| Non-audit fees (this year, total) | Not applicable |
| Going concern note | Cannot be determined |
| Accounting standard | Japanese GAAP |
Related books, articles and videos
Books that cover companies in the same industry
This company: not covered in the books below
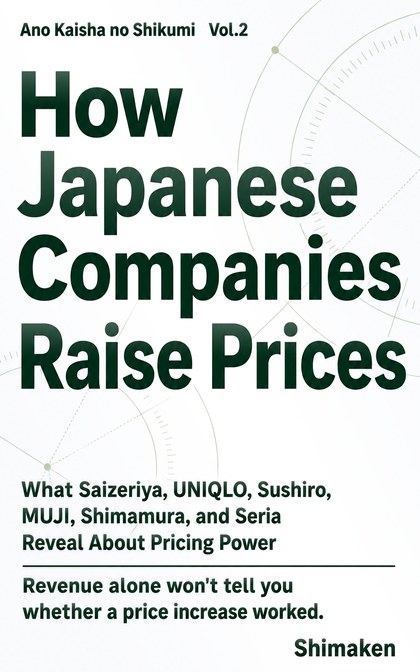 Same industry: Retail Trade
“Kaisha no Shikumi: Raising Prices”
Reads the filings of restaurant, clothing and household goods chains for how price increases relate to customer numbers.
Retail Trade companies in this book: saizeriya, FOOD & LIFE COMPANIES, FAST RETAILING and others (6 in all)
“Ano Kaisha no Shikumi” series, Vol.2 — Kindle and paperback
Find it on Amazon →
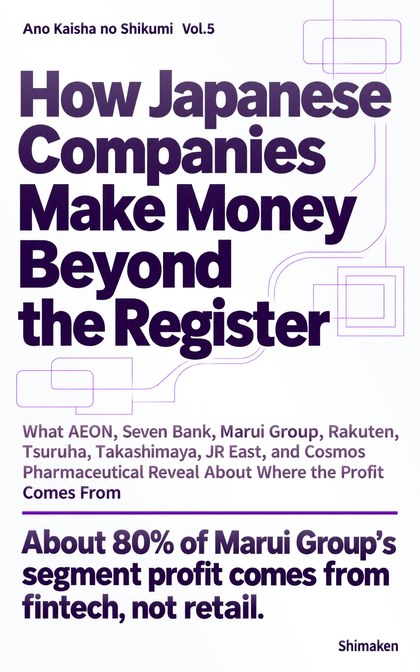 Same industry: Retail Trade
“Kaisha no Shikumi: Earning Beyond the Till”
Reads the filings of supermarkets, department stores and drugstores for money received under headings other than product sales, such as finance and rent.
Retail Trade companies in this book: AEON, TSURUHA, Takashimaya and others (5 in all)
“Ano Kaisha no Shikumi” series, Vol.5 — Kindle and paperback
Find it on Amazon →
Sources and methodology
Retrieved disclosed figures
Major management indicators (5 years) (17 items)
| Item | Value | Consolidated / Non-consolidated |
|---|---|---|
| Dividend per share | 1 yen | Parent only |
| Net cash provided by (used in) operating activities | ¥0.2 billion | Parent only |
| Net sales | ¥15.2 billion | Parent only |
| Net income (loss) | ¥1.1 billion | Parent only |
| Net cash provided by (used in) investing activities | ¥-0.4 billion | Parent only |
| Cash and cash equivalents | ¥0.8 billion | Parent only |
| Total number of issued shares (common stock) | 36,180,000 shares | Parent only |
| Net assets | ¥11.8 billion | Parent only |
| Ordinary income (loss) | ¥1.8 billion | Parent only |
| Total assets | ¥18.9 billion | Parent only |
| Return on equity | 9.9% | Parent only |
| Equity-to-asset ratio | 62.5% | Parent only |
| Net cash provided by (used in) financing activities | ¥-0.3 billion | Parent only |
| Capital stock | ¥0.8 billion | Parent only |
| Payout ratio | 2.9% | Parent only |
| Basic earnings (loss) per share | 34.36 yen | Parent only |
| Net assets per share | 364.95 yen | Parent only |
Employees (8 items)
| Item | Value | Consolidated / Non-consolidated |
|---|---|---|
| Wage gap between men and women (all employees) | 75.6% | Parent only |
| Average length of service (years) | 11.2 years | Parent only |
| Average annual salary | ¥5.03 million | Parent only |
| Average age (years) | 37.9 years old | Parent only |
| Number of employees | 420 people | Parent only |
| Number of employees | 420 people | Parent only |
| Wage gap between men and women (regular employees) | 88.8% | Parent only |
| Wage gap between men and women (non-regular employees) | 101.7% | Parent only |
Other disclosed items (6 items)
| Item | Value | Consolidated / Non-consolidated |
|---|---|---|
| Average number of temporary employees | 523 people | Parent only |
| Average number of temporary employees | 523 people | Parent only |
| Total return on the share price index | 217.8% | Parent only |
| Rate of male employees taking childcare leave (regular employees) | 0.0% | Parent only |
| Ratio of female employees in managerial positions | 28.2% | Parent only |
| Rate of male employees taking childcare leave (non-regular employees) | 0.0% | Parent only |
Shares (12 items)
| Item | Value | Consolidated / Non-consolidated |
|---|---|---|
| Number of shares held | 15,364,000 shares | Consolidated |
| Total number of shares held treasury shares etc | 3,784,400 shares | Consolidated |
| Number of issues whose number of shares increased shares other than those not listed investment shares held for purposes other than pure investment reporting company | 1 issues | Consolidated |
| Total acquisition cost for increased shares shares other than those not listed investment shares held for purposes other than pure investment reporting company | ¥1,000 | Consolidated |
| Number of shares | 36,180,000 shares | Consolidated |
| Shareholding ratio treasury shares etc | 10.5% | Consolidated |
| Shareholding ratio | 47.4% | Consolidated |
| Number of shares held in own name treasury shares etc | 3,784,400 shares | Consolidated |
| Number of voting rights | 323,642 units | Consolidated |
| Carrying amount on the balance sheet | ¥1.90 million | Consolidated |
| Number of issues | 1 issues | Consolidated |
| Total shareholder return | 308.4% | Parent only |
Property and facilities (1 items)
| Item | Value | Consolidated / Non-consolidated |
|---|---|---|
| Capital expenditures | ¥0.3 billion | Consolidated |
Audit (1 items)
| Item | Value | Consolidated / Non-consolidated |
|---|---|---|
| Fees for audit and attestation services - reporting company | ¥14.00 million | Consolidated |
Balance sheet (73 items)
| Item | Value | Consolidated / Non-consolidated |
|---|---|---|
| Other | ¥67.93 million | Parent only |
| Valuation difference on available-for-sale securities | ¥1.02 million | Parent only |
| Software | ¥14.39 million | Parent only |
| Work in process | ¥4.85 million | Parent only |
| Investments in capital | ¥0.83 million | Parent only |
| General reserve | ¥3.0 billion | Parent only |
| Retained earnings | ¥10.3 billion | Parent only |
| Legal retained earnings | ¥3.00 million | Parent only |
| Prepaid expenses | ¥70.85 million | Parent only |
| Raw materials and supplies | ¥22.79 million | Parent only |
| Merchandise and finished goods | ¥11.1 billion | Parent only |
| Non-current liabilities | ¥2.2 billion | Parent only |
| Non-current assets | ¥6.5 billion | Parent only |
| Land | ¥2.3 billion | Parent only |
| Accounts receivable - trade | ¥0.4 billion | Parent only |
| Contract liabilities | ¥48.70 million | Parent only |
| Tools, furniture and fixtures | ¥1.4 billion | Parent only |
| Tools, furniture and fixtures | ¥0.3 billion | Parent only |
| Guarantee deposits | ¥0.4 billion | Parent only |
| Buildings | ¥5.3 billion | Parent only |
| Buildings, net | ¥2.5 billion | Parent only |
| Construction in progress | ¥38.44 million | Parent only |
| Provision for directors' retirement benefits | ¥0.2 billion | Parent only |
| Investments and other assets | ¥1.0 billion | Parent only |
| Investment securities | ¥1.90 million | Parent only |
| Notes and accounts payable - trade | ¥22.86 million | Parent only |
| Property, plant and equipment | ¥5.4 billion | Parent only |
| Accounts receivable - other | ¥13.92 million | Parent only |
| Income taxes payable | ¥0.3 billion | Parent only |
| Accrued expenses | ¥93.26 million | Parent only |
| Accounts payable - other | ¥0.4 billion | Parent only |
| Provision for shareholder benefit program | ¥86.81 million | Parent only |
| Shareholders' equity | ¥11.8 billion | Parent only |
| Structures | ¥0.3 billion | Parent only |
| Structures, net | ¥0.2 billion | Parent only |
| Machinery and equipment | ¥0.2 billion | Parent only |
| Machinery and equipment, net | ¥33.45 million | Parent only |
| Current liabilities | ¥4.9 billion | Parent only |
| Current assets | ¥12.5 billion | Parent only |
| Accumulated depreciation | ¥-1.0 billion | Parent only |
| Accumulated depreciation | ¥-2.8 billion | Parent only |
| Accumulated depreciation | ¥-0.1 billion | Parent only |
| Accumulated depreciation | ¥-0.2 billion | Parent only |
| Accumulated depreciation | ¥-20.12 million | Parent only |
| Intangible assets | ¥14.39 million | Parent only |
| Reserve for special depreciation | ¥0.33 million | Parent only |
| Cash and cash equivalents | ¥0.8 billion | Parent only |
| Cash and deposits | ¥0.8 billion | Parent only |
| Short-term loans payable | ¥2.4 billion | Parent only |
| Net assets | ¥11.8 billion | Parent only |
| Net assets | ¥11.8 billion | Parent only |
| Total assets | ¥18.9 billion | Parent only |
| Deferred tax assets | ¥0.6 billion | Parent only |
| Retained earnings brought forward | ¥7.2 billion | Parent only |
| Treasury stock | ¥-0.4 billion | Parent only |
| Valuation and translation adjustments | ¥1.02 million | Parent only |
| Liabilities | ¥7.1 billion | Parent only |
| Liabilities and net assets | ¥18.9 billion | Parent only |
| Allowance for doubtful accounts | ¥-16.06 million | Parent only |
| Allowance for doubtful accounts | ¥-0.53 million | Parent only |
| Capital surplus | ¥1.1 billion | Parent only |
| Legal capital surplus | ¥1.1 billion | Parent only |
| Capital stock | ¥0.8 billion | Parent only |
| Asset retirement obligations | ¥83.77 million | Parent only |
| Provision for bonuses | ¥97.46 million | Parent only |
| Vehicle and delivery equipment | ¥20.12 million | Parent only |
| Vehicles, net | ¥0 | Parent only |
| Provision for retirement benefits | ¥0.8 billion | Parent only |
| Long-term loans payable | ¥1.1 billion | Parent only |
| Long-term prepaid expenses | ¥32.11 million | Parent only |
| Long-term loans receivable | ¥16.06 million | Parent only |
| Deposits received | ¥55.14 million | Parent only |
| Current portion of long-term loans payable | ¥1.4 billion | Parent only |
Statement of income (59 items)
| Item | Value | Consolidated / Non-consolidated |
|---|---|---|
| Other | ¥1.3 billion | Parent only |
| Dividends from surplus | ¥-32.87 million | Parent only |
| Interest income | ¥0.99 million | Parent only |
| Dividend income | ¥0.04 million | Parent only |
| Total | ¥17.9 billion | Parent only |
| Total | ¥0.1 billion | Parent only |
| Cost of merchandize sold | ¥6.9 billion | Parent only |
| Merchandize sales | ¥15.1 billion | Parent only |
| Ending goods | ¥11.0 billion | Parent only |
| Beginning goods | ¥10.0 billion | Parent only |
| Operating income | ¥1.8 billion | Parent only |
| Non-operating income | ¥11.11 million | Parent only |
| Non-operating expenses | ¥52.79 million | Parent only |
| Net cash provided by (used in) operating activities | ¥0.2 billion | Parent only |
| Cost of sales | ¥6.9 billion | Parent only |
| Gross profit (loss) | ¥8.3 billion | Parent only |
| Net sales | ¥15.2 billion | Parent only |
| Cost of purchased goods | ¥7.9 billion | Parent only |
| Net income (loss) | ¥1.1 billion | Parent only |
| Net income (loss) | ¥1.1 billion | Parent only |
| Cost of products manufactured | ¥38.53 million | Parent only |
| Directors' compensations | ¥0.2 billion | Parent only |
| Provision for directors' retirement benefits | ¥0.2 billion | Parent only |
| Net cash provided by (used in) investing activities | ¥-0.4 billion | Parent only |
| Interest expenses | ¥45.23 million | Parent only |
| Commission fees | ¥0.50 million | Parent only |
| Loss on retirement of property, plant and equipment | ¥2.27 million | Parent only |
| Provision for shareholder benefit program | ¥63.81 million | Parent only |
| Income taxes - current | ¥0.6 billion | Parent only |
| Income taxes | ¥0.6 billion | Parent only |
| Income taxes - deferred | ¥15.59 million | Parent only |
| Legal welfare expenses | ¥0.5 billion | Parent only |
| Supplies expenses | ¥0.1 billion | Parent only |
| Depreciation | ¥0.2 billion | Parent only |
| Foreign exchange gains | ¥0.40 million | Parent only |
| Gain on sales of goods | ¥1.27 million | Parent only |
| Extraordinary loss | ¥2.27 million | Parent only |
| Effect of exchange rate change on cash and cash equivalents | ¥0.20 million | Parent only |
| Net increase (decrease) in cash and cash equivalents | ¥-0.5 billion | Parent only |
| Interest on bonds | ¥0.09 million | Parent only |
| Welfare expenses | ¥0.1 billion | Parent only |
| Taxes and dues | ¥0.1 billion | Parent only |
| Income (loss) before income taxes | ¥1.7 billion | Parent only |
| Income (loss) before income taxes | ¥1.7 billion | Parent only |
| Ordinary income | ¥1.8 billion | Parent only |
| Salaries and bonuses | ¥2.0 billion | Parent only |
| Purchase of treasury stock | ¥-0.1 billion | Parent only |
| Cost of finished goods sold | ¥33.99 million | Parent only |
| Product sales revenue | ¥66.94 million | Parent only |
| Ending finished goods cos | ¥99.54 million | Parent only |
| Beginning finished goods cos | ¥95.00 million | Parent only |
| Net cash provided by (used in) financing activities | ¥-0.3 billion | Parent only |
| Selling, general and administrative expenses | ¥6.5 billion | Parent only |
| Rent expenses | ¥0.7 billion | Parent only |
| Provision for bonuses | ¥97.46 million | Parent only |
| Retirement benefit expenses | ¥-92.63 million | Parent only |
| Miscellaneous income | ¥5.41 million | Parent only |
| Other | ¥6.97 million | Parent only |
| Other salaries | ¥1.0 billion | Parent only |
Accounts unique to this company (1 items)
| Item | Value | Consolidated / Non-consolidated |
|---|---|---|
| Revenue | ¥3.00 million | Parent only |
Statement of changes in equity (2 items)
| Item | Value | Consolidated / Non-consolidated |
|---|---|---|
| Total changes during the period | ¥1.0 billion | Parent only |
| Net changes in items other than shareholders' equity | ¥0.43 million | Parent only |
Statement of cash flows (29 items)
| Item | Value | Consolidated / Non-consolidated |
|---|---|---|
| Other | ¥25.96 million | Parent only |
| Increase decrease in notes and accounts payable trade | ¥2.75 million | Parent only |
| Interest expenses paid | ¥-45.16 million | Parent only |
| Interest and dividends income received | ¥1.03 million | Parent only |
| Interest and dividend income | ¥-1.03 million | Parent only |
| Decrease increase in notes and accounts receivable trade | ¥-0.1 billion | Parent only |
| Subtotal | ¥1.0 billion | Parent only |
| Increase decrease in provision for directors retirement benefits | ¥0.2 billion | Parent only |
| Interest expenses | ¥45.32 million | Parent only |
| Proceeds from refund of leasehold deposits | ¥0.09 million | Parent only |
| Payments of leasehold and guarantee deposits | ¥-47.40 million | Parent only |
| Purchase of property plant and equipment | ¥-0.3 billion | Parent only |
| Loss on retirement of property, plant and equipment | ¥2.27 million | Parent only |
| Increase (decrease) in reserve for shareholder special benefit | ¥5.71 million | Parent only |
| Decrease (increase) in inventories | ¥-1.0 billion | Parent only |
| Income taxes refund (paid) | ¥-0.7 billion | Parent only |
| Depreciation | ¥0.2 billion | Parent only |
| Foreign exchange loss (gain) | ¥-0.40 million | Parent only |
| Purchase of intangible assets | ¥-3.31 million | Parent only |
| Increase in short term loans payable | ¥3.7 billion | Parent only |
| Decrease in short term loans payable | ¥-3.7 billion | Parent only |
| Redemption of bonds | ¥-40.00 million | Parent only |
| Regarding purchase of treasury stock | ¥-0.1 billion | Parent only |
| Increase (decrease) in allowance for doubtful accounts | ¥-1.44 million | Parent only |
| Increase (decrease) in provision for bonuses | ¥13.76 million | Parent only |
| Accrued pension cost | ¥-0.1 billion | Parent only |
| Dividends | ¥-33.30 million | Parent only |
| Proceeds from long term loans payable | ¥0.9 billion | Parent only |
| Repayment of long term loans payable | ¥-1.0 billion | Parent only |
Basic indicators
| Item | Value | Consolidated / Non-consolidated | Source |
|---|---|---|---|
| Net cash provided by (used in) operating activities | ¥0.2 billion | Parent only | Disclosed |
| Dividend per share | 1 | Parent only | Disclosed |
| Number of employees | 420 | Parent only | Disclosed |
| Net assets | ¥11.8 billion | Parent only | Disclosed |
| Net sales | ¥15.2 billion | Parent only | Disclosed |
| Operating income | ¥1.8 billion | Parent only | Disclosed |
| Ordinary income | ¥1.8 billion | Parent only | Disclosed |
| Total assets | ¥18.9 billion | Parent only | Disclosed |
| Operating margin | 11.8% | Parent only | Calculated |
| Net margin | Not disclosed | Not applicable | Not calculated (a required value is not disclosed) |
| Sales per employee | 36150121 yen | Parent only | Calculated |
| Total asset turnover | 0.8 times | Parent only | Calculated |
| Net assets to total assets | 62.5% | Parent only | Calculated |