Socionext
Socionext Inc.
Company highlights
Semiconductors are made by separate companies or divisions that divide design, manufacturing, and testing among them, and the prices and supply volumes of equipment and materials are set by product specifications, contract terms, factory production capacity, and inventory levels. The time between receiving an order and shipment, customer acceptance, revenue recognition, and receipt of payment depends on the contract, and investment in factories and equipment also becomes an expense through depreciation, spread over several years after the assets start operating.
Vol.2, Chapter 6 (as of 2026-09-20)
Key figures
Period Apr 2025 to Mar 2026ConsolidatedJapanese GAAP
Business revenue model
Featured in
Vol.2, Chapter 6 (as of 2026-09-20)
“How Prices and Supply Work in Japan's Semiconductor Industry”, Chapter 6: What a Chip Design Company Without Its Own Factory Sells
Book’s reference date 2026-09-20 / data last checked 2026-10-20
The move that changed Socionext
It decided to develop a CPU chiplet by combining Arm's CPU subsystem technology with TSMC's 2nm process and advanced packaging technology.
On October 18, 2023, Socionext announced that it would "collaborate with Arm and TSMC." The plan combines Arm's CPU subsystem technology with TSMC's 2nm process and advanced packaging technology to develop a CPU chiplet. A chiplet is a way of building a product by combining small chips each made for one function, and a CPU chiplet is the computing part of that. The stage the announcement shows is a proof of concept, which it calls PoC, and that is separate from any record of orders or product revenue. It is an effort by a company without plants to develop a leading-edge product by combining outside production capacity with outside circuit technology. The annual securities report for the year ended March 31, 2026, records that the company continued to work with Arm and TSMC on the development of leading-edge process, chiplet, and packaging technologies, and separately that it completed several tapeouts of leading-edge SoCs. A tapeout is the handover of design data to the manufacturing process. The NRE, product revenue, costs, and record of the start of volume production specific to the collaboration cannot be determined from the documents consulted.
Coverage in the book
- Making a Custom Chip Starts With Talks Before the Specification Is Fixed
- Revenue Splits Between Payment for Design and Payment for Volume Products
- At a Design Win, the Unit Price Is Agreed but the Volume Is Not
- Orders Received of ¥229,696 Million and a Design Win Amount of About ¥310.0 Billion Are Different Figures
- Even With Manufacturing Outsourced, Inventories and Trade Payables Arise at the Company
Related books, articles and videos
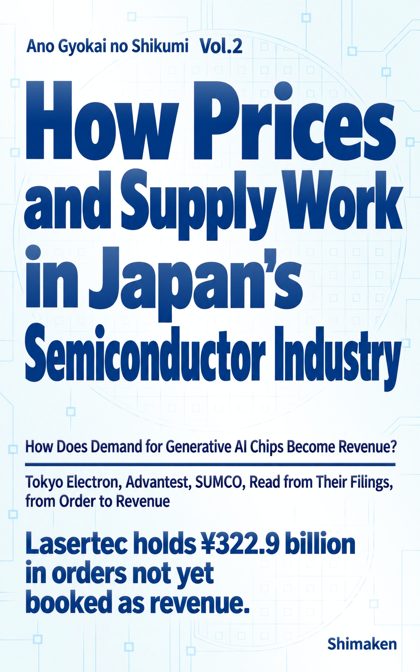 “How Prices and Supply Work in Japan's Semiconductor Industry”
Chapter 6: Socionext
“What a Chip Design Company Without Its Own Factory Sells”
“Ano Gyokai no Shikumi” series, Vol.2 — Kindle and paperback
Find it on Amazon →
Company profile
Tables scroll sideways
Disclosed data
Business activities and revenue composition
Revenue and profit by business segment
Disclosed segments (business divisions used in reporting): one
Revenue and profit
Socionext
Period Apr 2025 to Mar 2026Source Annual securities reports
Amounts by account
| Group | Account | Amount | Consolidated / Non-consolidated |
|---|---|---|---|
| Selling, general and administrative expenses | Research and development expenses | ¥58.5 billion | Consolidated |
| Salaries and allowances | ¥10.4 billion | Consolidated | |
| Retirement benefit expenses | ¥0.3 billion | Consolidated | |
| Profit by stage | Gross profit (loss) | ¥89.8 billion | Consolidated |
| Operating income | ¥12.4 billion | Consolidated | |
| Ordinary income | ¥11.8 billion | Consolidated | |
| Net income | ¥8.7 billion | Consolidated |
Socionext
Selling, general and administrative expenses
Period Apr 2025 to Mar 2026Source Annual securities reports
- Research and development expenses ¥58.5 billion
- Salaries and allowances ¥10.4 billion
- Retirement benefit expenses ¥0.3 billion
- Other (not itemized) ¥8.2 billion
Performance, financial position and capital allocation
Socionext
Recent performance trends
Source Annual securities reports
Year-on-year comparison
| Item | 2022 | 2023 | 2024 | 2025 | 2026 |
|---|---|---|---|---|---|
| Net sales | ¥117.0B | ¥192.8B | ¥221.2B | ¥188.5B | ¥200.8B |
| Year on year (%) | Could not be retrieved | +64.7%◆ | +14.8% | -14.8% | +6.5% |
| Ordinary income (loss) | ¥9.1B | ¥23.4B | ¥37.1B | ¥25.1B | ¥11.8B |
| Change from prior year | Could not be retrieved | +159.0% | +58.4% | -32.3% | -53.2% |
| Ordinary income (loss) as a share of Net sales | 7.7% | 12.2% | 16.8% | 13.3% | 5.9% |
| Change (percentage points) | Could not be retrieved | +4.4 points◆ | +4.6 points◆ | -3.5 points◆ | -7.5 points◆ |
Fiscal periods marked for changes
Earlier fiscal periods (1)
- 2023Net sales year on year +64.7%, Ordinary income (loss) as a share of revenue +4.4 points
- 2024Ordinary income (loss) as a share of revenue +4.6 points
- 2025Ordinary income (loss) as a share of revenue -3.5 points
- 2026Ordinary income (loss) as a share of revenue -7.5 points
Socionext
Earnings and net assets per share over time
Unit yenSource Annual securities reports
Socionext
Return on equity over time
Unit %Source Annual securities reports
Consolidated indicators (15 items)
| Item | 4 years ago | 3 years ago | 2 years ago | Last year | This year |
|---|---|---|---|---|---|
| Net sales | ¥117.0 billion | ¥192.8 billion | ¥221.2 billion | ¥188.5 billion | ¥200.8 billion |
| Ordinary income (loss) | ¥9.1 billion | ¥23.4 billion | ¥37.1 billion | ¥25.1 billion | ¥11.8 billion |
| Net income (loss) attributable to owners of parent | ¥7.5 billion | ¥19.8 billion | ¥26.1 billion | ¥19.6 billion | ¥8.7 billion |
| Comprehensive income | ¥8.0 billion | ¥20.3 billion | ¥27.3 billion | ¥19.4 billion | ¥9.7 billion |
| Net assets | ¥89.6 billion | ¥109.9 billion | ¥131.0 billion | ¥137.0 billion | ¥133.1 billion |
| Total assets | ¥118.4 billion | ¥193.9 billion | ¥186.8 billion | ¥170.3 billion | ¥167.6 billion |
| Net assets per share | 532.26 yen | 652.59 yen | 732.76 yen | 770.79 yen | 759.09 yen |
| Basic earnings (loss) per share | 44.44 yen | 117.4 yen | 148.39 yen | 109.78 yen | 49.74 yen |
| Diluted earnings per share | Could not be retrieved | 111.49 yen | 144.8 yen | 108.73 yen | 49.44 yen |
| Equity-to-asset ratio | 75.7% | 56.6% | 70.1% | 80.5% | 79.4% |
| Return on equity | 8.7% | 19.8% | 21.7% | 14.6% | 6.5% |
| Net cash provided by (used in) operating activities | ¥16.4 billion | ¥18.0 billion | ¥52.9 billion | ¥31.9 billion | ¥7.7 billion |
| Net cash provided by (used in) investing activities | ¥-7.9 billion | ¥-19.7 billion | ¥-23.2 billion | ¥-14.6 billion | ¥-22.9 billion |
| Net cash provided by (used in) financing activities | ¥-0.5 billion | ¥-0.3 billion | ¥-6.6 billion | ¥-13.8 billion | ¥-14.2 billion |
| Cash and cash equivalents | ¥46.3 billion | ¥45.1 billion | ¥69.7 billion | ¥72.8 billion | ¥44.5 billion |
Parent only indicators (15 items)
| Item | 4 years ago | 3 years ago | 2 years ago | Last year | This year |
|---|---|---|---|---|---|
| Net sales | ¥116.1 billion | ¥191.8 billion | ¥220.2 billion | ¥187.7 billion | ¥198.9 billion |
| Ordinary income (loss) | ¥7.8 billion | ¥21.4 billion | ¥36.6 billion | ¥23.2 billion | ¥10.8 billion |
| Net income (loss) | ¥6.5 billion | ¥18.1 billion | ¥26.3 billion | ¥18.0 billion | ¥8.3 billion |
| Capital stock | ¥30.2 billion | ¥30.2 billion | ¥32.7 billion | ¥33.0 billion | ¥33.0 billion |
| Total number of issued shares (common stock) | 60,000,000 shares | 33,666,666 shares | 178,687,405 shares | 179,756,405 shares | 179,968,630 shares |
| Net assets | ¥85.3 billion | ¥103.4 billion | ¥123.5 billion | ¥128.1 billion | ¥122.8 billion |
| Total assets | ¥112.2 billion | ¥184.7 billion | ¥174.0 billion | ¥157.6 billion | ¥151.1 billion |
| Net assets per share | 506.5 yen | 613.9 yen | 690.6 yen | 720.38 yen | 700.33 yen |
| Dividend per share | Could not be retrieved | 210 yen | Could not be retrieved | 50 yen | 50 yen |
| Interim dividend per share | Could not be retrieved | Could not be retrieved | 115 yen | 25 yen | 25 yen |
| Basic earnings (loss) per share | 38.55 yen | 107.4 yen | 149.4 yen | 100.61 yen | 47.44 yen |
| Diluted earnings per share | Could not be retrieved | 101.99 yen | 145.79 yen | 99.65 yen | 47.16 yen |
| Equity-to-asset ratio | 76.0% | 56.0% | 71.0% | 81.3% | 81.2% |
| Return on equity | 7.9% | 19.2% | 23.2% | 14.3% | 6.6% |
| Payout ratio | Could not be retrieved | 39.1% | 32.1% | 49.7% | 105.4% |
Dividend history
| Fiscal year | Annual dividend per share | Of which interim | Payout ratio (as reported, parent only) | Flag |
|---|---|---|---|---|
| FY ending 3/2026 | ¥50 | ¥25 | 105.4% | |
| FY ending 3/2025 | ¥50 | ¥25 | 49.7% | |
| FY 2024 | Could not be retrieved | Could not be retrieved | Could not be retrieved | |
| FY ending 3/2023 | ¥210 | Could not be retrieved | 39.1% | Stock split or share consolidation noted |
Socionext
Dividends per share over time
Unit yenSource Annual securities reports
Shareholder composition
Share ownership by holder category
Socionext
Unit %Source Annual securities reports
- Financial institutions32.56%
- Securities firms3.07%
- Other corporations3.13%
- Foreign holders (institutions)27.41%
- Foreign holders (individuals)0.25%
- Individuals and others33.54%
Major shareholders
| Rank | Shareholder | Shareholding ratio | Shares held |
|---|---|---|---|
| 1 | 日本マスタートラスト信託銀行株式会社(信託口) | 21.97% | 38,787,600 |
| 2 | 株式会社日本カストディ銀行(信託口) | 8.93% | 15,766,200 |
| 3 | STATE STREET BANK AND TRUST COMPANY 505301(常任代理人 みずほ銀行決済営業部) | 2.76% | 4,882,724 |
| 4 | JP MORGAN CHASE BANK 385781(常任代理人 株式会社みずほ銀行決済営業部) | 1.4% | 2,479,645 |
| 5 | NORTHERN TRUST CO.(AVFC) RE UKUC UCITS CLIENTS NON LENDING 10PCT TREATY ACCOUNT(常任代理人 香港上海銀行東京支店 セキュリティーズ・サービシズ・オペレーションズ部) | 1.32% | 2,338,900 |
| 6 | HSBC-FUND SERVICES CLIENTS A/C 500(常任代理人 香港上海銀行東京支店 セキュリティーズ・サービシズ・オペレーションズ部) | 1.24% | 2,203,500 |
| 7 | STATE STREET BANK AND TRUST COMPANY 505001(常任代理人 みずほ銀行決済営業部) | 1.21% | 2,149,288 |
| 8 | MSCO CUSTOMER SECURITIES(常任代理人 モルガン・スタンレーMUFG証券株式会社) | 1.07% | 1,893,854 |
| 9 | HSBC HONG KONG-TREASURYSERVICES A/C ASIAN EQUITIES DERIVATIVES(常任代理人 香港上海銀行東京支店 セキュリティーズ・サービシズ・オペレーションズ部) | 1.06% | 1,871,300 |
| 10 | MORGAN STANLEY & CO. LLC(常任代理人 モルガン・スタンレーMUFG証券株式会社) | 0.95% | 1,683,667 |
Research and development expenses and capital expenditure
Revenue scale in the same industry
Socionext
Source Annual securities reports of each company
Electric Appliances: 239 companies · revenue · largest first・each company’s latest fiscal year・Consolidated・Disclosed
- 1 SONY GROUPFY Mar 2026 ¥12.5T
- 2 HitachiFY Mar 2026 ¥10.6T
- 3 PanasonicFY Mar 2026 ¥8.0T
- … 56 companies
- 60 HIROSE ELECTRICFY Mar 2026 ¥211.3B
- 61 MCJFY Mar 2025 ¥207.2B
- 62 SocionextThis companyFY Mar 2026 ¥200.8B
- 63 MABUCHI MOTORFY Dec 2025 ¥200.4B
- 64 NITTO KOGYOFY Mar 2026 ¥195.8B
- … 175 companies
Workforce information
Women 8.8 yrs Average length of service by gender
Women 209 Employees by gender
Administrative filings and published information
Workplace information filings
| Item | Value |
|---|---|
| Employees | 2,111 |
| Annual paid leave taken |
80.3% |
| Childcare leave taken, men |
85.7% |
| Childcare leave taken, women |
100% |
| Share of managers who are women | 3.1% |
Greenhouse gas emissions
| Category | Emissions |
|---|---|
| 特定事業所排出者 | 4,076 t-CO2 |
Audit and disclosure information
| Item | Value |
|---|---|
| Audit firm | EY新日本有限責任監査法人 |
| Audit fees (this year, total) | ¥71.00 million |
| Non-audit fees (this year, total) | Not applicable |
| Audit fees (this year, network firms) | ¥58.00 million |
| Going concern note | Cannot be determined |
| Accounting standard | Japanese GAAP |
Sources and methodology
Retrieved disclosed figures
Major management indicators (5 years) (30 items)
| Item | Value | Consolidated / Non-consolidated |
|---|---|---|
| Comprehensive income | ¥9.7 billion | Consolidated |
| Net cash provided by (used in) operating activities | ¥7.7 billion | Consolidated |
| Net sales | ¥200.8 billion | Consolidated |
| Net cash provided by (used in) investing activities | ¥-22.9 billion | Consolidated |
| Diluted earnings per share | 49.44 yen | Consolidated |
| Cash and cash equivalents | ¥44.5 billion | Consolidated |
| Net assets | ¥133.1 billion | Consolidated |
| Ordinary income (loss) | ¥11.8 billion | Consolidated |
| Total assets | ¥167.6 billion | Consolidated |
| Return on equity | 6.5% | Consolidated |
| Equity-to-asset ratio | 79.4% | Consolidated |
| Net income (loss) attributable to owners of parent | ¥8.7 billion | Consolidated |
| Net cash provided by (used in) financing activities | ¥-14.2 billion | Consolidated |
| Basic earnings (loss) per share | 49.74 yen | Consolidated |
| Net assets per share | 759.09 yen | Consolidated |
| Dividend per share | 50 yen | Parent only |
| Net sales | ¥198.9 billion | Parent only |
| Net income (loss) | ¥8.3 billion | Parent only |
| Diluted earnings per share | 47.16 yen | Parent only |
| Total number of issued shares (common stock) | 179,968,630 shares | Parent only |
| Net assets | ¥122.8 billion | Parent only |
| Ordinary income (loss) | ¥10.8 billion | Parent only |
| Total assets | ¥151.1 billion | Parent only |
| Return on equity | 6.6% | Parent only |
| Equity-to-asset ratio | 81.2% | Parent only |
| Capital stock | ¥33.0 billion | Parent only |
| Payout ratio | 105.4% | Parent only |
| Interim dividend per share | 25 yen | Parent only |
| Basic earnings (loss) per share | 47.44 yen | Parent only |
| Net assets per share | 700.33 yen | Parent only |
Employees (10 items)
| Item | Value | Consolidated / Non-consolidated |
|---|---|---|
| Number of employees | 2,469 people | Consolidated |
| Number of employees | 2,469 people | Consolidated |
| Wage gap between men and women (all employees) | 74.8% | Parent only |
| Average length of service (years) | 9.6 years | Parent only |
| Average annual salary | ¥9.59 million | Parent only |
| Average age (years) | 50.6 years old | Parent only |
| Number of employees | 2,111 people | Parent only |
| Number of employees | 2,111 people | Parent only |
| Wage gap between men and women (regular employees) | 76.8% | Parent only |
| Wage gap between men and women (non-regular employees) | 58.5% | Parent only |
Accounts unique to this company (10 items)
| Item | Value | Consolidated / Non-consolidated |
|---|---|---|
| Revenue | ¥13.2 billion | Consolidated |
| Revenue | ¥55.00 million | Consolidated |
| Revenue | ¥0.1 billion | Consolidated |
| Revenue | ¥3.00 million | Consolidated |
| Revenue | 179,968,630 | Parent only |
| Revenue | 25 | Parent only |
| Change in average annual salary from the previous year | 3.6% | Parent only |
| Revenue | ¥13.2 billion | Parent only |
| Revenue | ¥55.00 million | Parent only |
| Revenue | ¥0.1 billion | Parent only |
Shares (10 items)
| Item | Value | Consolidated / Non-consolidated |
|---|---|---|
| Number of shares held | 74,056,678 shares | Consolidated |
| Total number of shares held treasury shares etc | 3,476,800 shares | Consolidated |
| Number of shares | 179,968,630 shares | Consolidated |
| Shareholding ratio treasury shares etc | 1.9% | Consolidated |
| Shareholding ratio | 42.0% | Consolidated |
| Number of shares held in own name treasury shares etc | 3,476,800 shares | Consolidated |
| Number of voting rights | 1,762,549 units | Consolidated |
| Carrying amount on the balance sheet | ¥0 | Consolidated |
| Number of issues | 2 issues | Consolidated |
| Total shareholder return | 105.8% | Parent only |
Other disclosed items (6 items)
| Item | Value | Consolidated / Non-consolidated |
|---|---|---|
| Scope1 greenhouse gas emissions | 522,815 t-CO2e | Consolidated |
| Gross scope 3 greenhouse gas emissions | 516,721 t-CO2e | Consolidated |
| Number of consolidated subsidiaries | 6 companies | Consolidated |
| Rate of male employees taking childcare leave (all employees) | 85.7% | Parent only |
| Total return on the share price index | 187.4% | Parent only |
| Ratio of female employees in managerial positions | 3.1% | Parent only |
Research and development (1 items)
| Item | Value | Consolidated / Non-consolidated |
|---|---|---|
| Research and development expenses | ¥58.5 billion | Consolidated |
Property and facilities (1 items)
| Item | Value | Consolidated / Non-consolidated |
|---|---|---|
| Capital expenditures | ¥22.2 billion | Consolidated |
Audit (4 items)
| Item | Value | Consolidated / Non-consolidated |
|---|---|---|
| Fees for audit and attestation services - reporting company | ¥71.00 million | Consolidated |
| Fees for audit and attestation services - total | ¥58.00 million | Consolidated |
| Fees for audit and attestation services - total | ¥71.00 million | Consolidated |
| Fees for audit and attestation services - consolidated subsidiaries | ¥58.00 million | Consolidated |
Balance sheet (97 items)
| Item | Value | Consolidated / Non-consolidated |
|---|---|---|
| Other | ¥1.6 billion | Consolidated |
| Other | ¥1.2 billion | Consolidated |
| Other | ¥5.6 billion | Consolidated |
| Other | ¥0.8 billion | Consolidated |
| Other | ¥1.9 billion | Consolidated |
| Work in process | ¥21.1 billion | Consolidated |
| Retained earnings | ¥74.1 billion | Consolidated |
| Prepaid expenses | ¥3.1 billion | Consolidated |
| Advance payments trade | ¥2.0 billion | Consolidated |
| Non-current liabilities | ¥2.0 billion | Consolidated |
| Non-current assets | ¥44.8 billion | Consolidated |
| Accounts receivable - trade | ¥36.9 billion | Consolidated |
| Tools, furniture and fixtures | ¥21.2 billion | Consolidated |
| Buildings and structures, net | ¥2.2 billion | Consolidated |
| Construction in progress | ¥0.4 billion | Consolidated |
| Investments and other assets | ¥5.8 billion | Consolidated |
| Investment securities | ¥0 | Consolidated |
| Deposit for subscriptions to shares | ¥3.00 million | Consolidated |
| Securities | ¥5.0 billion | Consolidated |
| Property, plant and equipment | ¥23.9 billion | Consolidated |
| Accounts receivable - other | ¥4.4 billion | Consolidated |
| Income taxes payable | ¥1.6 billion | Consolidated |
| Accrued expenses | ¥5.6 billion | Consolidated |
| Accounts payable - other | ¥4.0 billion | Consolidated |
| Shareholders' equity | ¥130.3 billion | Consolidated |
| Provision for stocks payment-NCL | ¥0.1 billion | Consolidated |
| Machinery, equipment and vehicles, net | ¥91.00 million | Consolidated |
| Current liabilities | ¥32.5 billion | Consolidated |
| Current assets | ¥122.8 billion | Consolidated |
| Accumulated depreciation | ¥-41.3 billion | Consolidated |
| Accumulated depreciation | ¥-3.0 billion | Consolidated |
| Accumulated depreciation | ¥-44.5 billion | Consolidated |
| Accumulated depreciation | ¥-0.2 billion | Consolidated |
| Foreign currency translation adjustment | ¥2.7 billion | Consolidated |
| Intangible assets | ¥15.1 billion | Consolidated |
| Cash and cash equivalents | ¥44.5 billion | Consolidated |
| Cash and deposits | ¥39.5 billion | Consolidated |
| Net assets | ¥133.1 billion | Consolidated |
| Net assets | ¥133.1 billion | Consolidated |
| Total assets | ¥167.6 billion | Consolidated |
| Deferred tax assets | ¥4.6 billion | Consolidated |
| Treasury stock | ¥-10.8 billion | Consolidated |
| Finished goods | ¥10.0 billion | Consolidated |
| Valuation and translation adjustments | ¥2.7 billion | Consolidated |
| Liabilities | ¥34.6 billion | Consolidated |
| Liabilities and net assets | ¥167.6 billion | Consolidated |
| Accounts payable - trade | ¥15.8 billion | Consolidated |
| Capital surplus | ¥33.9 billion | Consolidated |
| Capital stock | ¥33.0 billion | Consolidated |
| Asset retirement obligations | ¥0.4 billion | Consolidated |
| Other | ¥30.00 million | Parent only |
| Other | ¥1.1 billion | Parent only |
| Other | ¥0.6 billion | Parent only |
| Other | ¥0.8 billion | Parent only |
| Other | ¥1.9 billion | Parent only |
| Other capital surplus | ¥0.9 billion | Parent only |
| Work in process | ¥21.1 billion | Parent only |
| Retained earnings | ¥66.6 billion | Parent only |
| Prepaid expenses | ¥2.9 billion | Parent only |
| Advance payments trade | ¥2.0 billion | Parent only |
| Non-current liabilities | ¥0.5 billion | Parent only |
| Non-current assets | ¥45.3 billion | Parent only |
| Accounts receivable trade net | ¥41.6 billion | Parent only |
| Tools, furniture and fixtures | ¥20.9 billion | Parent only |
| Buildings | ¥0.7 billion | Parent only |
| Construction in progress | ¥0.4 billion | Parent only |
| Investments and other assets | ¥8.1 billion | Parent only |
| Investment securities | ¥0 | Parent only |
| Deposit for subscriptions to shares | ¥3.00 million | Parent only |
| Securities | ¥5.0 billion | Parent only |
| Property, plant and equipment | ¥22.0 billion | Parent only |
| Accounts receivable - other | ¥4.5 billion | Parent only |
| Income taxes payable | ¥1.2 billion | Parent only |
| Accrued expenses | ¥4.1 billion | Parent only |
| Accounts payable - other | ¥4.0 billion | Parent only |
| Shareholders' equity | ¥122.8 billion | Parent only |
| Provision for stocks payment-NCL | ¥0.1 billion | Parent only |
| Machinery and equipment, net | ¥0 | Parent only |
| Current liabilities | ¥27.9 billion | Parent only |
| Current assets | ¥105.9 billion | Parent only |
| Intangible assets | ¥15.1 billion | Parent only |
| Cash and deposits | ¥18.0 billion | Parent only |
| Net assets | ¥122.8 billion | Parent only |
| Net assets | ¥122.8 billion | Parent only |
| Total assets | ¥151.1 billion | Parent only |
| Deferred tax assets | ¥4.4 billion | Parent only |
| Retained earnings brought forward | ¥66.6 billion | Parent only |
| Treasury stock | ¥-10.8 billion | Parent only |
| Finished goods | ¥10.0 billion | Parent only |
| Liabilities | ¥28.4 billion | Parent only |
| Liabilities and net assets | ¥151.1 billion | Parent only |
| Accounts payable - trade | ¥18.1 billion | Parent only |
| Capital surplus | ¥33.9 billion | Parent only |
| Legal capital surplus | ¥33.0 billion | Parent only |
| Capital stock | ¥33.0 billion | Parent only |
| Asset retirement obligations | ¥0.3 billion | Parent only |
| Shares of subsidiaries and associates | ¥2.7 billion | Parent only |
Statement of income (60 items)
| Item | Value | Consolidated / Non-consolidated |
|---|---|---|
| Other | ¥26.00 million | Consolidated |
| Other | ¥0.1 billion | Consolidated |
| Other comprehensive income | ¥0.9 billion | Consolidated |
| Dividends from surplus | ¥-8.9 billion | Consolidated |
| Comprehensive income | ¥9.7 billion | Consolidated |
| Interest income | ¥0.4 billion | Consolidated |
| Operating income | ¥12.4 billion | Consolidated |
| Non-operating income | ¥0.4 billion | Consolidated |
| Non-operating expenses | ¥1.0 billion | Consolidated |
| Net cash provided by (used in) operating activities | ¥7.7 billion | Consolidated |
| Cost of sales | ¥111.1 billion | Consolidated |
| Gross profit (loss) | ¥89.8 billion | Consolidated |
| Net sales | ¥200.8 billion | Consolidated |
| Net income | ¥8.7 billion | Consolidated |
| Net income | ¥8.7 billion | Consolidated |
| Net income (loss) | ¥8.7 billion | Consolidated |
| Net income (loss) | ¥8.7 billion | Consolidated |
| Net cash provided by (used in) investing activities | ¥-22.9 billion | Consolidated |
| Income taxes - current | ¥1.5 billion | Consolidated |
| Income taxes | ¥3.0 billion | Consolidated |
| Income taxes - deferred | ¥1.5 billion | Consolidated |
| Foreign exchange losses | ¥0.9 billion | Consolidated |
| Foreign currency translation adjustment net of tax | ¥0.9 billion | Consolidated |
| Effect of exchange rate change on cash and cash equivalents | ¥1.1 billion | Consolidated |
| Net increase (decrease) in cash and cash equivalents | ¥-28.3 billion | Consolidated |
| Research and development expenses | ¥58.5 billion | Consolidated |
| Research and development expenses | ¥58.5 billion | Consolidated |
| Income (loss) before income taxes | ¥11.8 billion | Consolidated |
| Income (loss) before income taxes | ¥11.8 billion | Consolidated |
| Ordinary income | ¥11.8 billion | Consolidated |
| Salaries and allowances | ¥10.4 billion | Consolidated |
| Purchase of treasury stock | ¥-5.0 billion | Consolidated |
| Comprehensive income attributable to owners of parent | ¥9.7 billion | Consolidated |
| Net cash provided by (used in) financing activities | ¥-14.2 billion | Consolidated |
| Selling, general and administrative expenses | ¥77.4 billion | Consolidated |
| Retirement benefit expenses | ¥0.3 billion | Consolidated |
| Other | ¥0.1 billion | Parent only |
| Other | ¥88.00 million | Parent only |
| Dividends from surplus | ¥-8.9 billion | Parent only |
| Dividend income | ¥2.0 billion | Parent only |
| Operating income | ¥9.5 billion | Parent only |
| Non-operating income | ¥2.1 billion | Parent only |
| Non-operating expenses | ¥0.8 billion | Parent only |
| Cost of sales | ¥111.0 billion | Parent only |
| Gross profit (loss) | ¥87.9 billion | Parent only |
| Net sales | ¥198.9 billion | Parent only |
| Net income (loss) | ¥8.3 billion | Parent only |
| Net income (loss) | ¥8.3 billion | Parent only |
| Income taxes - current | ¥0.9 billion | Parent only |
| Income taxes | ¥2.4 billion | Parent only |
| Income taxes - deferred | ¥1.5 billion | Parent only |
| Foreign exchange losses | ¥0.7 billion | Parent only |
| Research and development expenses | ¥60.0 billion | Parent only |
| Research and development expenses | ¥60.0 billion | Parent only |
| Income (loss) before income taxes | ¥10.8 billion | Parent only |
| Ordinary income | ¥10.8 billion | Parent only |
| Salaries and allowances | ¥4.6 billion | Parent only |
| Purchase of treasury stock | ¥-5.0 billion | Parent only |
| Selling, general and administrative expenses | ¥78.4 billion | Parent only |
| Retirement benefit expenses | ¥0.2 billion | Parent only |
Statement of changes in equity (3 items)
| Item | Value | Consolidated / Non-consolidated |
|---|---|---|
| Total changes during the period | ¥-4.0 billion | Consolidated |
| Net changes in items other than shareholders' equity | ¥0.9 billion | Consolidated |
| Total changes during the period | ¥-5.3 billion | Parent only |
Statement of cash flows (19 items)
| Item | Value | Consolidated / Non-consolidated |
|---|---|---|
| Other | ¥2.4 billion | Consolidated |
| Other | ¥23.00 million | Consolidated |
| Increase (decrease) in other liabilities | ¥-0.5 billion | Consolidated |
| Decrease (increase) in other assets | ¥-5.4 billion | Consolidated |
| Proceeds from exercise of stock options | ¥53.00 million | Consolidated |
| Repayments of lease obligations | ¥-0.4 billion | Consolidated |
| Increase decrease in notes and accounts payable trade | ¥2.1 billion | Consolidated |
| Interest and dividends income received | ¥0.4 billion | Consolidated |
| Interest and dividend income | ¥-0.4 billion | Consolidated |
| Loss on retirement of non-current assets | ¥1.1 billion | Consolidated |
| Decrease increase in notes and accounts receivable trade | ¥-3.4 billion | Consolidated |
| Subtotal | ¥10.5 billion | Consolidated |
| Purchase of property plant and equipment | ¥-14.9 billion | Consolidated |
| Decrease (increase) in inventories | ¥-14.0 billion | Consolidated |
| Income taxes paid | ¥-3.2 billion | Consolidated |
| Depreciation | ¥16.9 billion | Consolidated |
| Purchase of intangible assets | ¥-8.1 billion | Consolidated |
| Regarding purchase of treasury stock | ¥-5.0 billion | Consolidated |
| Dividends | ¥-8.9 billion | Consolidated |
Basic indicators
| Item | Value | Consolidated / Non-consolidated | Source |
|---|---|---|---|
| Net cash provided by (used in) operating activities | ¥7.7 billion | Consolidated | Disclosed |
| Dividend per share | 50 | Parent only | Disclosed |
| Number of employees | 2,469 | Consolidated | Disclosed |
| Net assets | ¥133.1 billion | Consolidated | Disclosed |
| Net sales | ¥200.8 billion | Consolidated | Disclosed |
| Operating income | ¥12.4 billion | Consolidated | Disclosed |
| Ordinary income | ¥11.8 billion | Consolidated | Disclosed |
| Net income | ¥8.7 billion | Consolidated | Disclosed |
| Total assets | ¥167.6 billion | Consolidated | Disclosed |
| Operating margin | 6.2% | Consolidated | Calculated |
| Net margin | 4.3% | Consolidated | Calculated |
| Sales per employee | 81342244 yen | Consolidated | Calculated |
| Total asset turnover | 1.2 times | Consolidated | Calculated |
| Net assets to total assets | 79.4% | Consolidated | Calculated |