W-SCOPE
W-SCOPE Corporation
Company highlights
The largest segment by revenue is Separator, at 60.9% of the total.
Key figures
Period Feb 2025 to Jan 2026ConsolidatedJapanese GAAP
Company profile
Tables scroll sideways
Disclosed data
Business activities and revenue composition
W-SCOPE
Revenue and profit by business segment
Period Feb 2025 to Jan 2026Source Annual securities reportsConsolidated・Disclosed
| Business | Net sales to external customers | |
|---|---|---|
| This year | Share | |
| Separator | ¥2.2 billion | 60.9% |
| Ion Exchange Membrane | ¥1.4 billion | 39.1% |
| Total of the businesses | ¥3.6 billion | 100.0% |
Revenue and profit
W-SCOPE
Period Feb 2025 to Jan 2026Source Annual securities reports
Amounts by account
| Group | Account | Amount | Consolidated / Non-consolidated |
|---|---|---|---|
| Selling, general and administrative expenses | Salaries and allowances | ¥0.2 billion | Consolidated |
| Fee expenses | ¥0.1 billion | Consolidated | |
| Commission fees | ¥0.1 billion | Consolidated | |
| Directors' compensations | ¥0.1 billion | Consolidated | |
| Research and development expenses | ¥95.00 million | Consolidated | |
| Retirement benefit expenses | ¥38.00 million | Consolidated | |
| Taxes and dues | ¥36.00 million | Parent only | |
| Provision of allowance for doubtful accounts | ¥-29.00 million | Consolidated | |
| Depreciation | ¥2.00 million | Parent only | |
| Profit by stage | Net income | ¥-12.5 billion | Consolidated |
| Ordinary income | ¥-11.4 billion | Consolidated | |
| Operating income | ¥-4.9 billion | Consolidated | |
| Gross profit (loss) | ¥-4.0 billion | Consolidated |
W-SCOPE
Selling, general and administrative expenses
Period Feb 2025 to Jan 2026Source Annual securities reports
- Salaries and allowances ¥0.2 billion
- Fee expenses ¥0.1 billion
- Commission fees ¥0.1 billion
- Directors' compensations ¥0.1 billion
- Research and development expenses ¥0.1 billion
- Retirement benefit expenses ¥0.0 billion
- Other (not itemized) ¥0.2 billion
Performance, financial position and capital allocation
Long-term changes in performance
W-SCOPE
Long-term revenue, profit and asset trends
Period 2012 to 2026Source Annual securities reportsDisclosed
W-SCOPE
Recent performance trends
Source Annual securities reports
Year-on-year comparison
| Item | 2022 | 2023 | 2024 | 2025 | 2026 |
|---|---|---|---|---|---|
| Net sales | ¥30.0B | ¥45.1B | ¥48.0B | ¥31.0B | ¥3.6B |
| Year on year (%) | Could not be retrieved | +50.5%◆ | comparison basis not confirmed | -35.4%◆ | -88.3%◆ |
| Ordinary income (loss) | -¥3.4B | ¥8.3B | ¥4.6B | -¥3.2B | -¥11.4B |
| Change from prior year | Could not be retrieved | loss to profit◆ | comparison basis not confirmed | profit to loss◆ | 3.52x |
| Ordinary income (loss) as a share of Net sales | -11.4% | 18.4% | 9.6% | -10.4% | -314.4% |
| Change (percentage points) | Could not be retrieved | +29.8 points◆ | comparison basis not confirmed | -20.0 points◆ | -303.9 points◆ |
Fiscal periods marked for changes
Earlier fiscal periods (8)
- 2013Ordinary income (loss) as a share of revenue -12.8 points
- 2014Net sales year on year +66.4%, Ordinary income (loss) as a share of revenue +11.0 points
- 2015Net sales year on year +64.7%, Ordinary income (loss) as a share of revenue +12.2 points
- 2016Net sales year on year +21.5%
- 2017Ordinary income (loss) as a share of revenue -28.5 points, Ordinary income (loss) profit to loss
- 2018Ordinary income (loss) as a share of revenue -36.7 points
- 2019Net sales year on year +50.8%, Ordinary income (loss) as a share of revenue +7.9 points
- 2020Net sales year on year +40.3%, Ordinary income (loss) as a share of revenue -12.3 points
- 2023Net sales year on year +50.5%, Ordinary income (loss) as a share of revenue +29.8 points, Ordinary income (loss) loss to profit
- 2025Net sales year on year -35.4%, Ordinary income (loss) as a share of revenue -20.0 points, Ordinary income (loss) profit to loss
- 2026Net sales year on year -88.3%, Ordinary income (loss) as a share of revenue -303.9 points
W-SCOPE
Earnings and net assets per share over time
Unit yenSource Annual securities reports
W-SCOPE
Return on equity over time
Unit %Source Annual securities reports
Consolidated indicators (15 items)
| Item | 4 years ago | 3 years ago | 2 years ago | Last year | This year |
|---|---|---|---|---|---|
| Net sales | ¥30.0 billion | ¥45.1 billion | ¥48.0 billion | ¥31.0 billion | ¥3.6 billion |
| Ordinary income (loss) | ¥-3.4 billion | ¥8.3 billion | ¥4.6 billion | ¥-3.2 billion | ¥-11.4 billion |
| Net income (loss) attributable to owners of parent | ¥-2.9 billion | ¥4.4 billion | ¥0.9 billion | ¥-3.7 billion | ¥-12.5 billion |
| Comprehensive income | ¥-1.8 billion | ¥13.8 billion | ¥11.5 billion | ¥2.4 billion | ¥-9.2 billion |
| Net assets | ¥50.4 billion | ¥113.3 billion | ¥123.8 billion | ¥49.7 billion | ¥40.9 billion |
| Total assets | ¥83.4 billion | ¥139.5 billion | ¥171.0 billion | ¥60.1 billion | ¥52.0 billion |
| Net assets per share | 561.43 yen | 911.67 yen | 974.41 yen | 902.47 yen | 707.26 yen |
| Basic earnings (loss) per share | -56.67 yen | 80.43 yen | 17.07 yen | -67.6 yen | -225.88 yen |
| Diluted earnings per share | Could not be retrieved | 78.52 yen | 16.93 yen | Could not be retrieved | Could not be retrieved |
| Equity-to-asset ratio | 36.7% | 36.1% | 31.3% | 82.5% | 78.5% |
| Return on equity | -14.5% | 10.9% | 1.8% | -7.5% | -27.6% |
| Net cash provided by (used in) operating activities | ¥2.3 billion | ¥6.6 billion | ¥13.2 billion | ¥4.0 billion | ¥0.7 billion |
| Net cash provided by (used in) investing activities | ¥-2.4 billion | ¥-28.3 billion | ¥-51.0 billion | ¥-28.7 billion | ¥-0.7 billion |
| Net cash provided by (used in) financing activities | ¥8.9 billion | ¥41.7 billion | ¥15.0 billion | ¥17.3 billion | ¥22.00 million |
| Cash and cash equivalents | ¥11.5 billion | ¥32.8 billion | ¥12.0 billion | ¥0.3 billion | ¥0.3 billion |
Parent only indicators (12 items)
| Item | 4 years ago | 3 years ago | 2 years ago | Last year | This year |
|---|---|---|---|---|---|
| Net sales | ¥0.5 billion | ¥1.4 billion | ¥0.5 billion | ¥0.6 billion | ¥0.2 billion |
| Ordinary income (loss) | ¥-0.7 billion | ¥-0.1 billion | ¥-0.2 billion | ¥-0.2 billion | ¥-0.3 billion |
| Net income (loss) | ¥8.3 billion | ¥0.6 billion | ¥-0.2 billion | ¥-0.2 billion | ¥-5.7 billion |
| Capital stock | ¥15.2 billion | ¥15.4 billion | ¥15.4 billion | ¥15.4 billion | ¥15.6 billion |
| Total number of issued shares (common stock) | 54,471,600 shares | 55,180,600 shares | 55,225,600 shares | 55,225,600 shares | 58,025,700 shares |
| Net assets | ¥30.3 billion | ¥31.3 billion | ¥30.8 billion | ¥30.5 billion | ¥25.2 billion |
| Total assets | ¥32.2 billion | ¥31.4 billion | ¥30.8 billion | ¥30.7 billion | ¥25.6 billion |
| Net assets per share | 555.7 yen | 564.8 yen | 558.04 yen | 553.71 yen | 435.23 yen |
| Basic earnings (loss) per share | 160.43 yen | 11.36 yen | -3.5 yen | -4.33 yen | -103.69 yen |
| Diluted earnings per share | 158.12 yen | 11.09 yen | Could not be retrieved | Could not be retrieved | Could not be retrieved |
| Equity-to-asset ratio | 94.0% | 99.4% | 99.5% | 99.1% | 98.2% |
| Return on equity | 36.2% | 2.0% | -0.6% | -0.8% | -20.6% |
Dividend history
| Fiscal year | Annual dividend per share | Of which interim | Payout ratio (as reported, parent only) | Flag |
|---|---|---|---|---|
| FY ending 12/2018 | ¥2.5 | Could not be retrieved | 39.8% | |
| FY ending 12/2017 | ¥2.5 | Could not be retrieved | 7.2% | |
| FY ending 12/2016 | ¥2.5 | Could not be retrieved | 19.5% | Stock split or share consolidation noted |
| FY ending 12/2015 | ¥10 | Could not be retrieved | 11.7% |
Shareholder composition
Share ownership by holder category
W-SCOPE
Unit %Source Annual securities reports
- Financial institutions9.84%
- Securities firms5.24%
- Other corporations1.98%
- Foreign holders (institutions)13.78%
- Foreign holders (individuals)8.34%
- Individuals and others60.82%
Major shareholders
| Rank | Shareholder | Shareholding ratio | Shares held |
|---|---|---|---|
| 1 | 崔元根(CHOI WON-KUN)(弁護士法人R&G横浜法律事務所)CHUNGBUK, KOREA( | 8.42% | 4,862,000 |
| 2 | 日本マスタートラスト信託銀行株式会社(信託口) | 8.38% | 4,837,500 |
| 3 | KOREA SECURITIES DEPOSITORY-SHINHAN INVESTMENT(シティバンク、エヌ・エイ東京支店)34-6, YEOUIDO-DONG, YEONGDEUNGPO-GU, SEOUL, KOREA (新宿区新宿6丁目27番30号) | 3.07% | 1,771,000 |
| 4 | BBH CO FOR ARCUS JAPAN VALUE FUND(株式会社三菱UFJ銀行) | 2.54% | 1,464,000 |
| 5 | JPモルガン証券株式会社千代田区丸の内2丁目7番3号 | 1.83% | 1,056,248 |
| 6 | KOREA SECURITIES DEPOSITORY-SAMSUNG(シティバンク、エヌ・エイ東京支店)34-6, YEOUIDO-DONG, YEONGDEUNGPO-GU, SEOUL, KOREA(新宿区新宿6丁目27番30号) | 1.34% | 775,800 |
| 7 | 株式会社日本カストディ銀行(信託口) | 1.17% | 675,800 |
| 8 | 株式会社SBI証券港区六本木1丁目6番1号 | 1.07% | 617,723 |
| 9 | JP JPMSE LUX RE NOMURA INT PLC 1 EQ CO(株式会社三菱UFJ銀行) | 0.8% | 460,680 |
| 10 | KSD-MIRAE ASSET SECURITIES (CLIENT)(シティバンク、エヌ・エイ東京支店)BIFC | 0.73% | 420,400 |
Research and development expenses and capital expenditure
| Fiscal year | Research and development |
|---|---|
| FY ending 1/2026 | ¥0.7 billion |
| FY ending 1/2025 | ¥0.9 billion |
| FY ending 12/2020 | ¥0.5 billion |
| FY ending 12/2019 | ¥1.1 billion |
| FY ending 12/2016 | ¥0.2 billion |
| FY ending 12/2015 | ¥0.3 billion |
Revenue scale in the same industry
W-SCOPE
Source Annual securities reports of each company
Electric Appliances: 239 companies · revenue · largest first・each company’s latest fiscal year・consolidated (parent-only where no consolidated figures)・Disclosed
- 1 SONY GROUPFY Mar 2026 ¥12.5T
- 2 HitachiFY Mar 2026 ¥10.6T
- 3 PanasonicFY Mar 2026 ¥8.0T
- … 214 companies
- 218 FUJI ELECTRIC INDUSTRYFY Jan 2026 ¥3.8B
- 219 TAIYO TECHNOLEXFY Dec 2025 ¥3.8B
- 220 W-SCOPEThis companyFY Jan 2026 ¥3.6B
- 221 JN GroupFY Nov 2025 ¥3.6B
- 222 Artiza NetworksFY Jul 2025 ¥2.7B
- … 17 companies
Workforce information
Audit and disclosure information
| Item | Value |
|---|---|
| Audit firm | ForvisMazarsJapan有限責任監査法人 |
| Audit fees (this year, total) | ¥53.00 million |
| Non-audit fees (this year, total) | Not applicable |
| Going concern note | Cannot be determined |
| Accounting standard | Japanese GAAP |
Related books, articles and videos
Books that cover companies in the same industry
This company: not covered in this book
 Same industry: Electric Appliances
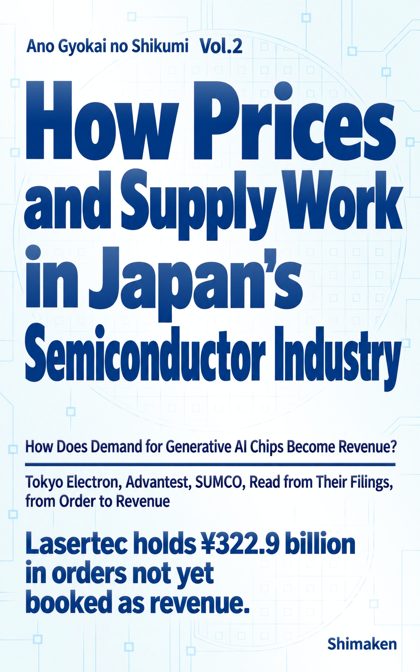
“How Prices and Supply Work in Japan's Semiconductor Industry”
Reads the filings of makers of chips and of chip-making and testing equipment for the time lag from order to sales and cash, and for how prices and supply are set.
Electric Appliances companies in this book: Tokyo Electron, ADVANTEST, Lasertec and others (5 in all)
“Ano Gyokai no Shikumi” series, Vol.2 — Kindle and paperback
Find it on Amazon →
Sources and methodology
Retrieved disclosed figures
Major management indicators (5 years) (25 items)
| Item | Value | Consolidated / Non-consolidated |
|---|---|---|
| Comprehensive income | ¥-9.2 billion | Consolidated |
| Net cash provided by (used in) operating activities | ¥0.7 billion | Consolidated |
| Net sales | ¥3.6 billion | Consolidated |
| Net cash provided by (used in) investing activities | ¥-0.7 billion | Consolidated |
| Cash and cash equivalents | ¥0.3 billion | Consolidated |
| Net assets | ¥40.9 billion | Consolidated |
| Ordinary income (loss) | ¥-11.4 billion | Consolidated |
| Total assets | ¥52.0 billion | Consolidated |
| Return on equity | -27.6% | Consolidated |
| Equity-to-asset ratio | 78.5% | Consolidated |
| Net income (loss) attributable to owners of parent | ¥-12.5 billion | Consolidated |
| Net cash provided by (used in) financing activities | ¥22.00 million | Consolidated |
| Basic earnings (loss) per share | -225.88 yen | Consolidated |
| Net assets per share | 707.26 yen | Consolidated |
| Net sales | ¥0.2 billion | Parent only |
| Net income (loss) | ¥-5.7 billion | Parent only |
| Total number of issued shares (common stock) | 58,025,700 shares | Parent only |
| Net assets | ¥25.2 billion | Parent only |
| Ordinary income (loss) | ¥-0.3 billion | Parent only |
| Total assets | ¥25.6 billion | Parent only |
| Return on equity | -20.6% | Parent only |
| Equity-to-asset ratio | 98.2% | Parent only |
| Capital stock | ¥15.6 billion | Parent only |
| Basic earnings (loss) per share | -103.69 yen | Parent only |
| Net assets per share | 435.23 yen | Parent only |
Employees (11 items)
| Item | Value | Consolidated / Non-consolidated |
|---|---|---|
| Number of employees | 274 people | Consolidated |
| Number of employees | 274 people | Consolidated |
| Wage gap between men and women (all employees) | 46.5% | Parent only |
| Average length of service (years) | 6 years | Parent only |
| Average length of service months | 9 months | Parent only |
| Average annual salary | ¥7.74 million | Parent only |
| Average age (years) | 41 years old | Parent only |
| Average age months | 0 months | Parent only |
| Number of employees | 6 people | Parent only |
| Number of employees | 6 people | Parent only |
| Number of employees | 6 people | Parent only |
Shares (8 items)
| Item | Value | Consolidated / Non-consolidated |
|---|---|---|
| Number of shares held | 16,941,151 shares | Consolidated |
| Total number of shares held treasury shares etc | 300,600 shares | Consolidated |
| Number of shares | 58,025,700 shares | Consolidated |
| Shareholding ratio treasury shares etc | 0.5% | Consolidated |
| Shareholding ratio | 29.3% | Consolidated |
| Number of shares held in own name treasury shares etc | 300,600 shares | Consolidated |
| Number of voting rights | 576,571 units | Consolidated |
| Total shareholder return | 18.0% | Parent only |
Other disclosed items (9 items)
| Item | Value | Consolidated / Non-consolidated |
|---|---|---|
| Net sales to external customers | ¥3.6 billion | Consolidated |
| Number of associates accounted for using equity method | 2 companies | Consolidated |
| Investments accounted for using equity method | ¥34.0 billion | Consolidated |
| Increase in property plant and equipment and intangible assets | ¥1.1 billion | Consolidated |
| Write-downs of inventories | ¥0.3 billion | Consolidated |
| Depreciation | ¥1.5 billion | Consolidated |
| Number of consolidated subsidiaries | 2 companies | Consolidated |
| Total return on the share price index | 223.0% | Parent only |
| Ratio of female employees in managerial positions | 0.0% | Parent only |
Research and development (2 items)
| Item | Value | Consolidated / Non-consolidated |
|---|---|---|
| Research and development expenses included in general and administrative expenses and manufacturing cost for current period | ¥0.7 billion | Consolidated |
| Research and development expenses | ¥0.7 billion | Consolidated |
Audit (2 items)
| Item | Value | Consolidated / Non-consolidated |
|---|---|---|
| Fees for audit and attestation services - reporting company | ¥53.00 million | Consolidated |
| Fees for audit and attestation services - total | ¥53.00 million | Consolidated |
Balance sheet (91 items)
| Item | Value | Consolidated / Non-consolidated |
|---|---|---|
| Other | ¥91.00 million | Consolidated |
| Other | ¥10.00 million | Consolidated |
| Other | ¥0.8 billion | Consolidated |
| Other | ¥0.3 billion | Consolidated |
| Other | ¥0.6 billion | Consolidated |
| Other | ¥14.00 million | Consolidated |
| Other, net | ¥0.2 billion | Consolidated |
| Retained earnings | ¥-28.2 billion | Consolidated |
| Raw materials and supplies | ¥0.3 billion | Consolidated |
| Notes receivable - trade | ¥0.7 billion | Consolidated |
| Merchandise and finished goods | ¥0.6 billion | Consolidated |
| Trade accounts receivable | ¥0.8 billion | Consolidated |
| Non-current liabilities | ¥2.5 billion | Consolidated |
| Non-current assets | ¥48.1 billion | Consolidated |
| Accounts receivable - trade | ¥0.7 billion | Consolidated |
| Buildings and structures | ¥7.7 billion | Consolidated |
| Buildings and structures, net | ¥5.4 billion | Consolidated |
| Construction in progress | ¥3.2 billion | Consolidated |
| Investments and other assets | ¥36.3 billion | Consolidated |
| Investment securities | ¥34.6 billion | Consolidated |
| Notes and accounts payable - trade | ¥0.4 billion | Consolidated |
| Subscription rights to shares | ¥0.1 billion | Consolidated |
| Property, plant and equipment | ¥11.8 billion | Consolidated |
| Income taxes payable | ¥13.00 million | Consolidated |
| Accounts payable - other | ¥0.9 billion | Consolidated |
| Shareholders' equity | ¥30.5 billion | Consolidated |
| Machinery, equipment and vehicles | ¥24.4 billion | Consolidated |
| Machinery, equipment and vehicles, net | ¥3.0 billion | Consolidated |
| Current liabilities | ¥8.6 billion | Consolidated |
| Current assets | ¥3.9 billion | Consolidated |
| Accumulated depreciation | ¥-0.6 billion | Consolidated |
| Accumulated depreciation | ¥-2.3 billion | Consolidated |
| Accumulated depreciation | ¥-21.4 billion | Consolidated |
| Foreign currency translation adjustment | ¥10.3 billion | Consolidated |
| Intangible assets | ¥14.00 million | Consolidated |
| Cash and cash equivalents | ¥0.3 billion | Consolidated |
| Cash and deposits | ¥0.3 billion | Consolidated |
| Short-term loans payable | ¥6.7 billion | Consolidated |
| Short-term loans receivable with resale agreement | ¥0.6 billion | Consolidated |
| Net assets | ¥40.9 billion | Consolidated |
| Net assets | ¥40.9 billion | Consolidated |
| Total assets | ¥52.0 billion | Consolidated |
| Total assets | ¥52.0 billion | Consolidated |
| Deferred tax assets | ¥1.4 billion | Consolidated |
| Treasury stock | ¥-0.3 billion | Consolidated |
| Provision for product warranties | ¥0 | Consolidated |
| Valuation and translation adjustments | ¥10.3 billion | Consolidated |
| Liabilities | ¥11.1 billion | Consolidated |
| Liabilities and net assets | ¥52.0 billion | Consolidated |
| Allowance for doubtful accounts | ¥-0.5 billion | Consolidated |
| Capital surplus | ¥43.4 billion | Consolidated |
| Capital stock | ¥15.6 billion | Consolidated |
| Asset retirement obligations | ¥0.8 billion | Consolidated |
| Net defined benefit liability | ¥0.5 billion | Consolidated |
| Long-term loans payable | ¥1.2 billion | Consolidated |
| Long-term loans receivable | ¥0.3 billion | Consolidated |
| Current portion of bonds payable | ¥0.3 billion | Consolidated |
| Current portion of long-term loans payable | ¥22.00 million | Consolidated |
| Other | ¥7.00 million | Parent only |
| Other | ¥41.00 million | Parent only |
| Other | ¥64.00 million | Parent only |
| Retained earnings | ¥-5.6 billion | Parent only |
| Non-current assets | ¥24.7 billion | Parent only |
| Accounts receivable trade net | ¥53.00 million | Parent only |
| Tools, furniture and fixtures | ¥14.00 million | Parent only |
| Buildings | ¥5.00 million | Parent only |
| Investments and other assets | ¥24.7 billion | Parent only |
| Subscription rights to shares | ¥0.1 billion | Parent only |
| Property, plant and equipment | ¥8.00 million | Parent only |
| Income taxes payable | ¥13.00 million | Parent only |
| Shareholders' equity | ¥25.1 billion | Parent only |
| Current liabilities | ¥0.3 billion | Parent only |
| Current assets | ¥0.9 billion | Parent only |
| Accumulated depreciation | ¥-10.00 million | Parent only |
| Cash and deposits | ¥0.2 billion | Parent only |
| Short-term loans receivable with resale agreement | ¥0.6 billion | Parent only |
| Net assets | ¥25.2 billion | Parent only |
| Net assets | ¥25.2 billion | Parent only |
| Total assets | ¥25.6 billion | Parent only |
| Retained earnings brought forward | ¥-5.6 billion | Parent only |
| Treasury stock | ¥-0.3 billion | Parent only |
| Liabilities | ¥0.3 billion | Parent only |
| Liabilities and net assets | ¥25.6 billion | Parent only |
| Accounts payable - trade | ¥18.00 million | Parent only |
| Capital surplus | ¥15.5 billion | Parent only |
| Legal capital surplus | ¥15.5 billion | Parent only |
| Capital stock | ¥15.6 billion | Parent only |
| Long-term loans receivable | ¥0.3 billion | Parent only |
| Shares of subsidiaries and associates | ¥24.1 billion | Parent only |
| Bonds of subsidiaries and affiliates | ¥0.2 billion | Parent only |
| Current portion of bonds payable | ¥0.3 billion | Parent only |
Statement of income (80 items)
| Item | Value | Consolidated / Non-consolidated |
|---|---|---|
| Other | ¥65.00 million | Consolidated |
| Other | ¥66.00 million | Consolidated |
| Other comprehensive income | ¥3.3 billion | Consolidated |
| Subsidy income | ¥0.1 billion | Consolidated |
| Comprehensive income | ¥-9.2 billion | Consolidated |
| Interest income | ¥5.00 million | Consolidated |
| Guaranty money income | ¥0.1 billion | Consolidated |
| Operating income | ¥-4.9 billion | Consolidated |
| Non-operating income | ¥0.3 billion | Consolidated |
| Non-operating expenses | ¥6.8 billion | Consolidated |
| Net cash provided by (used in) operating activities | ¥0.7 billion | Consolidated |
| Cost of sales | ¥7.6 billion | Consolidated |
| Gross profit (loss) | ¥-4.0 billion | Consolidated |
| Gross profit (loss) | ¥-4.0 billion | Consolidated |
| Net sales | ¥3.6 billion | Consolidated |
| Net sales | ¥3.6 billion | Consolidated |
| Net income | ¥-12.5 billion | Consolidated |
| Net income | ¥-12.5 billion | Consolidated |
| Net income (loss) | ¥-12.5 billion | Consolidated |
| Net income (loss) | ¥-12.5 billion | Consolidated |
| Directors' compensations | ¥0.1 billion | Consolidated |
| Net cash provided by (used in) investing activities | ¥-0.7 billion | Consolidated |
| Share of loss of investments accounted for using equity method | ¥6.3 billion | Consolidated |
| Share of other comprehensive income of investments accounted for using equity method | ¥4.1 billion | Consolidated |
| Interest expenses | ¥0.2 billion | Consolidated |
| Fee expenses | ¥0.1 billion | Consolidated |
| Commission fees | ¥0.1 billion | Consolidated |
| Issuance of new shares | ¥0.4 billion | Consolidated |
| Income taxes - current | ¥0 | Consolidated |
| Income taxes | ¥5.00 million | Consolidated |
| Income taxes - deferred | ¥4.00 million | Consolidated |
| Impairment loss | ¥0.6 billion | Consolidated |
| Impairment loss | ¥0.6 billion | Consolidated |
| Impairment loss | ¥0.6 billion | Consolidated |
| Foreign exchange losses | ¥0.2 billion | Consolidated |
| Foreign currency translation adjustment net of tax | ¥-0.8 billion | Consolidated |
| Extraordinary loss | ¥1.0 billion | Consolidated |
| Effect of exchange rate change on cash and cash equivalents | ¥-30.00 million | Consolidated |
| Net increase (decrease) in cash and cash equivalents | ¥9.00 million | Consolidated |
| Research and development expenses | ¥95.00 million | Consolidated |
| Income (loss) before income taxes | ¥-12.5 billion | Consolidated |
| Income (loss) before income taxes | ¥-12.5 billion | Consolidated |
| Ordinary income | ¥-11.4 billion | Consolidated |
| Salaries and allowances | ¥0.2 billion | Consolidated |
| Purchase of treasury stock | ¥-0 | Consolidated |
| Comprehensive income attributable to owners of parent | ¥-9.2 billion | Consolidated |
| Net cash provided by (used in) financing activities | ¥22.00 million | Consolidated |
| Selling, general and administrative expenses | ¥0.9 billion | Consolidated |
| Provision of allowance for doubtful accounts | ¥-29.00 million | Consolidated |
| Retirement benefit expenses | ¥38.00 million | Consolidated |
| Loss on sale of shares of subsidiaries and associates | ¥0.5 billion | Consolidated |
| Other | ¥0 | Parent only |
| Interest income | ¥31.00 million | Parent only |
| Operating income | ¥-0.3 billion | Parent only |
| Non-operating income | ¥31.00 million | Parent only |
| Non-operating expenses | ¥41.00 million | Parent only |
| Cost of sales | ¥0.2 billion | Parent only |
| Gross profit (loss) | ¥24.00 million | Parent only |
| Net sales | ¥0.2 billion | Parent only |
| Net income (loss) | ¥-5.7 billion | Parent only |
| Net income (loss) | ¥-5.7 billion | Parent only |
| Directors' compensations | ¥52.00 million | Parent only |
| Fee expenses | ¥74.00 million | Parent only |
| Commission fees | ¥14.00 million | Parent only |
| Commission fees | ¥52.00 million | Parent only |
| Issuance of new shares | ¥0.4 billion | Parent only |
| Issuance cost of subscription rights to shares-NOE | ¥11.00 million | Parent only |
| Income taxes - current | ¥1.00 million | Parent only |
| Income taxes | ¥1.00 million | Parent only |
| Depreciation | ¥2.00 million | Parent only |
| Foreign exchange losses | ¥15.00 million | Parent only |
| Extraordinary loss | ¥5.4 billion | Parent only |
| Taxes and dues | ¥36.00 million | Parent only |
| Income (loss) before income taxes | ¥-5.7 billion | Parent only |
| Ordinary income | ¥-0.3 billion | Parent only |
| Salaries and allowances | ¥47.00 million | Parent only |
| Purchase of treasury stock | ¥-0 | Parent only |
| Selling, general and administrative expenses | ¥0.3 billion | Parent only |
| Loss on sale of shares of subsidiaries and associates | ¥0.2 billion | Parent only |
| Loss on valuation of shares of subsidiaries and associates | ¥4.1 billion | Parent only |
Statement of changes in equity (4 items)
| Item | Value | Consolidated / Non-consolidated |
|---|---|---|
| Total changes during the period | ¥-8.7 billion | Consolidated |
| Net changes in items other than shareholders' equity | ¥3.3 billion | Consolidated |
| Total changes during the period | ¥-5.3 billion | Parent only |
| Net changes in items other than shareholders' equity | ¥0 | Parent only |
Statement of cash flows (29 items)
| Item | Value | Consolidated / Non-consolidated |
|---|---|---|
| Other | ¥-0.3 billion | Consolidated |
| Other | ¥16.00 million | Consolidated |
| Other | ¥-46.00 million | Consolidated |
| Increase decrease in notes and accounts payable trade | ¥0.1 billion | Consolidated |
| Interest expenses paid | ¥-0.3 billion | Consolidated |
| Interest and dividends income received | ¥5.00 million | Consolidated |
| Interest and dividend income | ¥-5.00 million | Consolidated |
| Decrease increase in notes and accounts receivable trade | ¥2.9 billion | Consolidated |
| Subtotal | ¥1.1 billion | Consolidated |
| Purchase of investment securities | ¥-99.00 million | Consolidated |
| Proceeds from sales of investment securities | ¥29.00 million | Consolidated |
| Equity in earnings losses of affiliates | ¥6.3 billion | Consolidated |
| Interest expenses | ¥0.2 billion | Consolidated |
| Proceeds from exercise of share acquisition rights | ¥0.4 billion | Consolidated |
| Purchase of property plant and equipment | ¥-1.1 billion | Consolidated |
| Proceeds from sales of property plant and equipment | ¥0.8 billion | Consolidated |
| Increase (decrease) in accounts payable-other | ¥0.5 billion | Consolidated |
| Decrease (increase) in inventories | ¥1.2 billion | Consolidated |
| Income taxes paid | ¥-54.00 million | Consolidated |
| Depreciation | ¥1.5 billion | Consolidated |
| Impairment loss | ¥0.6 billion | Consolidated |
| Foreign exchange loss (gain) | ¥35.00 million | Consolidated |
| Decrease in short term loans payable | ¥-0.6 billion | Consolidated |
| Proceeds from issuance of short term bonds | ¥0.3 billion | Consolidated |
| Payments of short term loans receivable | ¥-0.6 billion | Consolidated |
| Regarding purchase of treasury stock | ¥-0 | Consolidated |
| Increase (decrease) in allowance for doubtful accounts | ¥-29.00 million | Consolidated |
| Proceeds from sales of shares of subsidiaries and affiliates | ¥0.2 billion | Consolidated |
| Loss (gain) on sale of shares of subsidiaries and associates | ¥0.5 billion | Consolidated |
Accounts unique to this company (3 items)
| Item | Value | Consolidated / Non-consolidated |
|---|---|---|
| Revenue | ¥95.00 million | Consolidated |
| Revenue | ¥0.6 billion | Consolidated |
| Revenue | ¥1.1 billion | Parent only |
Basic indicators
| Item | Value | Consolidated / Non-consolidated | Source |
|---|---|---|---|
| Net cash provided by (used in) operating activities | ¥0.7 billion | Consolidated | Disclosed |
| Number of employees | 274 | Consolidated | Disclosed |
| Net assets | ¥40.9 billion | Consolidated | Disclosed |
| Net sales | ¥3.6 billion | Consolidated | Disclosed |
| Operating income | ¥-4.9 billion | Consolidated | Disclosed |
| Ordinary income | ¥-11.4 billion | Consolidated | Disclosed |
| Net income | ¥-12.5 billion | Consolidated | Disclosed |
| Total assets | ¥52.0 billion | Consolidated | Disclosed |
| Operating margin | -135.5% | Consolidated | Calculated |
| Net margin | -343.4% | Consolidated | Calculated |
| Sales per employee | 13248175 yen | Consolidated | Calculated |
| Total asset turnover | 0.07 times | Consolidated | Calculated |
| Net assets to total assets | 78.7% | Consolidated | Calculated |