ZENSHO
ZENSHO HOLDINGS CO.,LTD.
Company highlights
A company that books the sale itself, with no franchisee in between.
Vol.3, Chapter 1 (as of 2026-08-19)
Key figures
Period Apr 2025 to Mar 2026ConsolidatedJapanese GAAP
Business revenue model
Featured in
Vol.3, Chapter 1 (as of 2026-08-19)
“Kaisha no Shikumi: Franchising”, Chapter 1: 7-Eleven and Sukiya: The Same Kind of Chain, Opposite Ways of Growing
Book’s reference date 2026-08-19 / data last checked 2026-10-20
Key points in this volumeA chain's profits depend on how the money is divided, not just on how many stores it has.
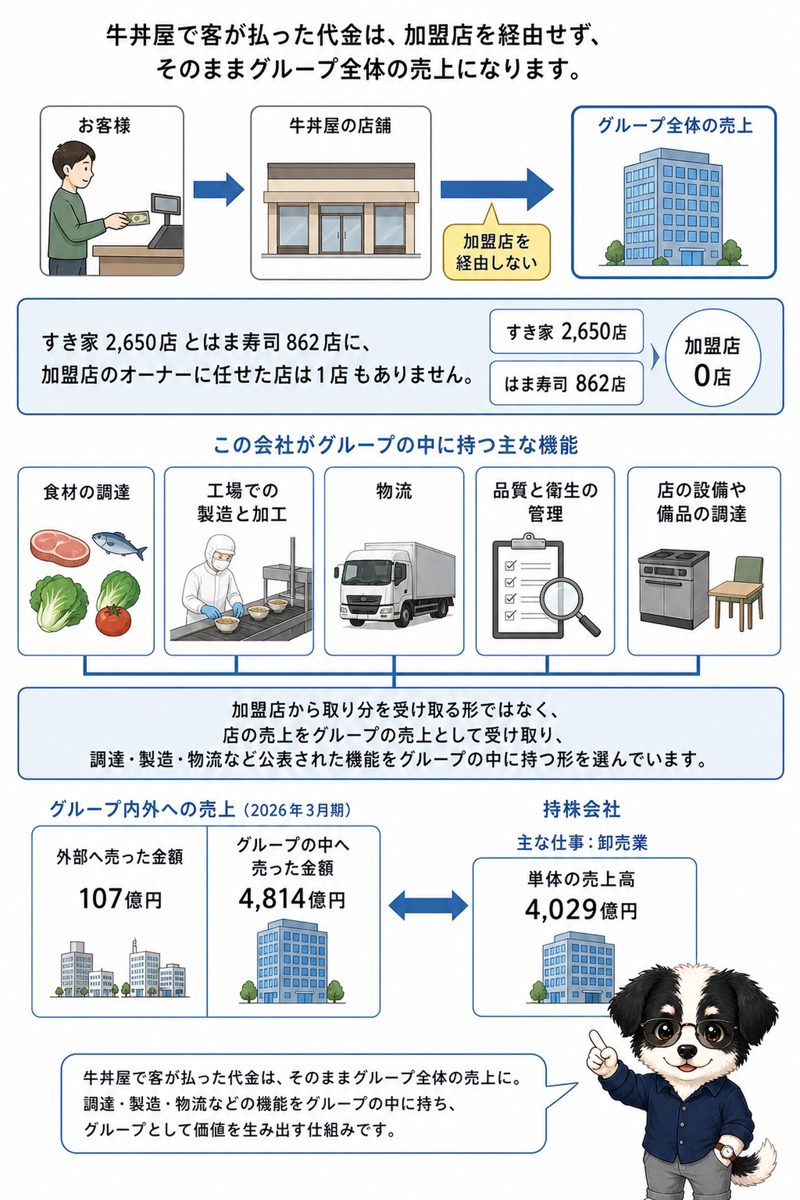
What you pay for a beef bowl at Sukiya becomes Zensho Holdings' consolidated sales without passing through a franchisee. The path the money takes is the reverse of Seven-Eleven's.
The same word, chain, covers both leaving shops to other people and taking a cut of their gross margin, and holding the shops and receiving the sales directly. How a chain expands shows up directly in the shape of its accounts.
The Move That Changed Zensho
It kept Sukiya and Hama Sushi in Japan at 0 franchised stores and bought companies overseas that came with franchise networks.
For the year ended March 2023, Zensho Holdings had net sales of ¥780 billion ($4.88 billion), operating profit of ¥21.7 billion, and a consolidated franchise ratio of 44.6%. In Japan it placed no franchisees and kept everything from ingredients to stores inside the group through MMD. In 2023 the company bought companies overseas one after another: Lotteria in April, Sushi Circle of Germany in May, and SnowFox on September 15. The SnowFox acquisition was announced at ¥87.5 billion, and the final accounting cost of acquisition was ¥48.1 billion. Together with AFC of the United States, acquired in November 2018 for ¥34.7 billion, a franchise network of takeaway sushi counters inside supermarkets came into the group. For the year ended March 2026, net sales were ¥1.2641 trillion, operating profit ¥81.4 billion, and the consolidated franchise ratio 55.1%. Of the 8,235 franchised stores, 8,102 are sushi counters inside supermarkets overseas, and Sukiya and Hama Sushi remain at 0 franchised stores.
Coverage in the book
- Sukiya Has No Franchise Owners
- 98% of the 8,235 Franchised Stores Are Takeaway Sushi Counters Overseas
- In 2014, What Sukiya Changed Was Not the Contract but the Management of Its Stores
- Zensho's Nine Fiscal Years and Its Dividend Policy
- The Two Companies in One Table
Related books, articles and videos
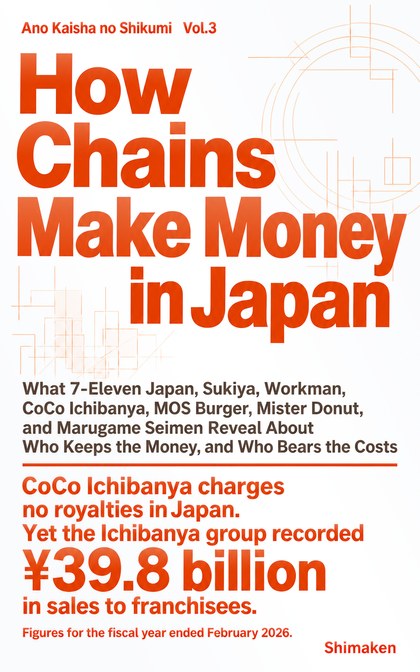 “Kaisha no Shikumi: Franchising”
Chapter 1: ZENSHO
“7-Eleven and Sukiya: The Same Kind of Chain, Opposite Ways of Growing”
“Ano Kaisha no Shikumi” series, Vol.3 — Kindle and paperback
Find it on Amazon →

Company profile
Tables scroll sideways
Disclosed data
Business activities and revenue composition
ZENSHO
Revenue and profit by business segment
Period Apr 2025 to Mar 2026Source Annual securities reportsConsolidated・Disclosed
| Business | Net sales to external customers | Operating income | ||||
|---|---|---|---|---|---|---|
| This year | Share | Last year | This year | Margin | Last year | |
| Global hamazushi | ¥320.3 billion | 26.1% | ¥248.5 billion | ¥26.8 billion | 8.4% | ¥21.4 billion |
| Global sukiya | ¥314.5 billion | 25.6% | ¥295.8 billion | ¥9.3 billion | 3.0% | ¥24.5 billion |
| Global Prepared Food | ¥221.9 billion | 18.1% | ¥209.9 billion | ¥27.4 billion | 12.3% | ¥25.6 billion |
| Restaurant | ¥171.3 billion | 13.9% | ¥156.1 billion | ¥13.0 billion | 7.6% | ¥11.4 billion |
| Global fastfood | ¥112.8 billion | 9.2% | ¥104.2 billion | ¥3.3 billion | 2.9% | ¥3.6 billion |
| Retail | ¥77.0 billion | 6.3% | ¥76.0 billion | ¥-1.0 billion | -1.3% | ¥-1.8 billion |
| Headoffice and support | ¥10.7 billion | 0.9% | ¥4.9 billion | ¥2.8 billion | 26.0% | ¥-7.4 billion |
| Total of the businesses | ¥1,228.4 billion | 100.0% | ||||
Revenue and profit
ZENSHO
Period Apr 2025 to Mar 2026Source Annual securities reports
Amounts by account
| Group | Account | Amount | Consolidated / Non-consolidated |
|---|---|---|---|
| Selling, general and administrative expenses | Other salaries | ¥188.4 billion | Consolidated |
| Salaries and allowances | ¥68.2 billion | Consolidated | |
| Rents | ¥64.3 billion | Consolidated | |
| Provision for bonuses | ¥9.3 billion | Consolidated | |
| Commission fees | ¥5.7 billion | Parent only | |
| Amortization of goodwill | ¥1.2 billion | Consolidated | |
| Retirement benefit expenses | ¥1.1 billion | Consolidated | |
| Depreciation | ¥1.0 billion | Parent only | |
| Research and development expenses | ¥0.9 billion | Consolidated | |
| Provision for dividend | ¥0.4 billion | Consolidated | |
| Profit by stage | Gross profit (loss) | ¥686.4 billion | Consolidated |
| Operating income | ¥81.4 billion | Consolidated | |
| Ordinary income | ¥78.3 billion | Consolidated | |
| Net income | ¥45.8 billion | Consolidated |
ZENSHO
Selling, general and administrative expenses
Period Apr 2025 to Mar 2026Source Annual securities reports
- Other salaries ¥188.4 billion
- Salaries and allowances ¥68.2 billion
- Rents ¥64.3 billion
- Provision for bonuses ¥9.3 billion
- Commission fees ¥5.7 billion
- Amortization of goodwill ¥1.2 billion
- Other (not itemized) ¥268.0 billion
Performance, financial position and capital allocation
Long-term changes in performance
ZENSHO
Long-term revenue, profit and asset trends
Period 2013 to 2026Source Annual securities reportsDisclosed
ZENSHO
Recent performance trends
Source Annual securities reports
Year-on-year comparison
| Item | 2022 | 2023 | 2024 | 2025 | 2026 |
|---|---|---|---|---|---|
| Net sales | ¥658.5B | ¥780.0B | ¥965.8B | ¥1,136.7B | ¥1,264.1B |
| Year on year (%) | Could not be retrieved | +18.4% | +23.8%◆ | +17.7% | +11.2% |
| Ordinary income (loss) | ¥23.1B | ¥28.1B | ¥50.9B | ¥71.9B | ¥78.3B |
| Change from prior year | Could not be retrieved | +21.5% | +81.3% | +41.2% | +8.9% |
| Ordinary income (loss) as a share of Net sales | 3.5% | 3.6% | 5.3% | 6.3% | 6.2% |
| Change (percentage points) | Could not be retrieved | +0.1 points | +1.7 points | +1.1 points | -0.1 points |
Fiscal periods marked for changes
- 2024Net sales year on year +23.8%
ZENSHO
Earnings and net assets per share over time
Unit yenSource Annual securities reports
ZENSHO
Return on equity over time
Unit %Source Annual securities reports
Consolidated indicators (14 items)
| Item | 4 years ago | 3 years ago | 2 years ago | Last year | This year |
|---|---|---|---|---|---|
| Net sales | ¥658.5 billion | ¥780.0 billion | ¥965.8 billion | ¥1,136.7 billion | ¥1,264.1 billion |
| Ordinary income (loss) | ¥23.1 billion | ¥28.1 billion | ¥50.9 billion | ¥71.9 billion | ¥78.3 billion |
| Net income (loss) attributable to owners of parent | ¥13.9 billion | ¥13.3 billion | ¥30.7 billion | ¥39.3 billion | ¥45.8 billion |
| Comprehensive income | ¥22.1 billion | ¥18.2 billion | ¥40.8 billion | ¥37.3 billion | ¥66.4 billion |
| Net assets | ¥104.5 billion | ¥115.8 billion | ¥214.7 billion | ¥240.4 billion | ¥341.4 billion |
| Total assets | ¥427.2 billion | ¥469.6 billion | ¥748.1 billion | ¥813.1 billion | ¥960.4 billion |
| Net assets per share | 679.19 yen | 761.63 yen | 1,171.76 yen | 1,335.69 yen | 1,665.94 yen |
| Basic earnings (loss) per share | 91.17 yen | 87.3 yen | 195.41 yen | 240.45 yen | 275.85 yen |
| Equity-to-asset ratio | 24.2% | 24.6% | 28.7% | 29.5% | 35.5% |
| Return on equity | 14.7% | 12.1% | 18.6% | 17.3% | 15.8% |
| Net cash provided by (used in) operating activities | ¥45.4 billion | ¥53.1 billion | ¥86.0 billion | ¥79.0 billion | ¥101.2 billion |
| Net cash provided by (used in) investing activities | ¥-31.6 billion | ¥-35.2 billion | ¥-125.4 billion | ¥-66.5 billion | ¥-78.1 billion |
| Net cash provided by (used in) financing activities | ¥-12.0 billion | ¥1.8 billion | ¥54.6 billion | ¥-16.2 billion | ¥19.8 billion |
| Cash and cash equivalents | ¥42.4 billion | ¥64.7 billion | ¥82.2 billion | ¥79.7 billion | ¥128.1 billion |
Parent only indicators (14 items)
| Item | 4 years ago | 3 years ago | 2 years ago | Last year | This year |
|---|---|---|---|---|---|
| Net sales | ¥216.4 billion | ¥256.3 billion | ¥294.8 billion | ¥334.3 billion | ¥402.9 billion |
| Ordinary income (loss) | ¥5.6 billion | ¥13.4 billion | ¥7.8 billion | ¥7.0 billion | ¥28.8 billion |
| Net income (loss) | ¥5.4 billion | ¥12.0 billion | ¥7.5 billion | ¥8.4 billion | ¥29.6 billion |
| Capital stock | ¥27.0 billion | ¥27.0 billion | ¥47.5 billion | ¥47.5 billion | ¥47.5 billion |
| Total number of issued shares (common stock) | 154,862,825 shares | 154,862,825 shares | 160,733,525 shares | 160,733,525 shares | 170,733,525 shares |
| Net assets | ¥78.1 billion | ¥86.2 billion | ¥150.9 billion | ¥148.3 billion | ¥211.9 billion |
| Total assets | ¥373.3 billion | ¥400.5 billion | ¥535.5 billion | ¥597.6 billion | ¥658.7 billion |
| Net assets per share | 513.38 yen | 568.08 yen | 766.67 yen | 749.81 yen | 841.07 yen |
| Dividend per share | 22 yen | 24 yen | 50 yen | 70 yen | 75 yen |
| Interim dividend per share | 11 yen | 12 yen | 25 yen | 35 yen | 35 yen |
| Basic earnings (loss) per share | 35.6 yen | 78.72 yen | 43.93 yen | 43.19 yen | 172.44 yen |
| Equity-to-asset ratio | 20.9% | 21.5% | 28.2% | 24.8% | 32.2% |
| Return on equity | 7.0% | 14.6% | 6.3% | 5.6% | 16.4% |
| Payout ratio | 61.8% | 30.5% | 113.8% | 162.1% | 43.5% |
Dividend history
| Fiscal year | Annual dividend per share | Of which interim | Payout ratio (as reported, parent only) | Flag |
|---|---|---|---|---|
| FY ending 3/2026 | ¥75 | ¥35 | 43.5% | |
| FY ending 3/2025 | ¥70 | ¥35 | 162.1% | |
| FY ending 3/2024 | ¥50 | ¥25 | 113.8% | |
| FY ending 3/2023 | ¥24 | ¥12 | 30.5% | |
| FY ending 3/2022 | ¥22 | ¥11 | 61.8% |
ZENSHO
Dividends per share over time
Unit yenSource Annual securities reports
Shareholder composition
Share ownership by holder category
ZENSHO
Unit %Source Annual securities reports
- Financial institutions12.50%
- Securities firms0.80%
- Other corporations39.20%
- Foreign holders (institutions)17.10%
- Foreign holders (individuals)0.00%
- Individuals and others30.30%
Major shareholders
| Rank | Shareholder | Shareholding ratio | Shares held |
|---|---|---|---|
| 1 | ㈱日本クリエイト | 36.16% | 60,299,000 |
| 2 | 日本マスタートラスト信託銀行㈱(信託口) | 7.92% | 13,201,000 |
| 3 | ㈱日本カストディ銀行(信託口) | 2.84% | 4,735,000 |
| 4 | THE CHASE MANHATTAN BANK, N.A. LONDONSECS LENDING OMNIBUS ACCOUNT(常任代理人 ㈱みずほ銀行決済営業部) | 1.92% | 3,203,000 |
| 5 | ゼンショーグループ社員持株会 | 1.52% | 2,540,000 |
| 6 | BNY GCM CLIENT ACCOUNT JPRD AC ISG (FE-AC)(常任代理人 ㈱三菱UFJ銀行) | 0.83% | 1,385,000 |
| 7 | JP MORGAN CHASE BANK 385781(常任代理人 ㈱みずほ銀行決済営業部) | 0.8% | 1,338,000 |
| 8 | JP MORGAN CHASE BANK 385642(常任代理人 ㈱みずほ銀行決済営業部) | 0.75% | 1,243,000 |
| 9 | STATE STREET BANK AND TRUST COMPANY 505001(常任代理人 ㈱みずほ銀行決済営業部) | 0.73% | 1,217,000 |
| 10 | UBS AG LONDON A/C IPB SEGREGATED CLIENT ACCOUNT(常任代理人 シティバンク、エヌ・エイ東京支店 カストディ業務部) | 0.63% | 1,050,000 |
Research and development expenses and capital expenditure
Research and development expenses and capital expenditure by segment (FY ending 3/2026)
| Segment | Research and development | Capital expenditure |
|---|---|---|
| Global hamazushi | Could not be retrieved | ¥27.5 billion |
| Global sukiya | Could not be retrieved | ¥34.3 billion |
| Global Prepared Food | Could not be retrieved | ¥8.3 billion |
| Restaurant | Could not be retrieved | ¥10.8 billion |
| Global fastfood | Could not be retrieved | ¥11.4 billion |
| Headoffice and support | ¥0.9 billion | ¥21.4 billion |
Revenue scale in the same industry
ZENSHO
Source Annual securities reports of each company
Retail Trade: 343 companies · revenue · largest first・each company’s latest fiscal year・Consolidated・Disclosed
- 1 AEONFY Feb 2026 ¥10.7T
- 2 Seven & iFY Feb 2026 ¥10.4T
- 3 FAST RETAILINGFY Aug 2025 ¥3.4T
- … 2 companies
- 6 TSURUHAFY Feb 2026 ¥1.5T
- 7 TRIALFY Jun 2026 ¥1.3T
- 8 ZENSHOThis companyFY Mar 2026 ¥1.3T
- 9 MatsukiyoCocokara &FY Mar 2026 ¥1.1T
- 10 COSMOS PharmaceuticalFY May 2026 ¥1.1T
- … 333 companies
Workforce information
Administrative filings and published information
Workplace information filings
| Item | Value |
|---|---|
| Employees | 1,872 |
| Childcare leave taken, men |
48.5% |
| Childcare leave taken, women |
100% |
| Share of managers who are women | 13.8% |
Subsidy award information
| Date approved | Subsidy | Ministry | Amount |
|---|---|---|---|
| 2022-07-28 | 米穀周年供給・需要拡大支援事業 | 農林水産省 | ¥20.00 million |
Greenhouse gas emissions
| Category | Emissions |
|---|---|
| 特定事業所排出者 | 3,365 t-CO2 |
Audit and disclosure information
| Item | Value |
|---|---|
| Audit firm | PwCJapan有限責任監査法人 |
| Audit fees (this year, total) | ¥0.2 billion |
| Non-audit fees (this year, total) | ¥9.00 million |
| Audit fees (this year, network firms) | ¥97.00 million |
| Non-audit fees (this year, network firms) | ¥15.00 million |
| Going concern note | Cannot be determined |
| Accounting standard | Japanese GAAP |
Sources and methodology
Retrieved disclosed figures
Major management indicators (5 years) (28 items)
| Item | Value | Consolidated / Non-consolidated |
|---|---|---|
| Comprehensive income | ¥66.4 billion | Consolidated |
| Net cash provided by (used in) operating activities | ¥101.2 billion | Consolidated |
| Net sales | ¥1,264.1 billion | Consolidated |
| Net cash provided by (used in) investing activities | ¥-78.1 billion | Consolidated |
| Cash and cash equivalents | ¥128.1 billion | Consolidated |
| Net assets | ¥341.4 billion | Consolidated |
| Ordinary income (loss) | ¥78.3 billion | Consolidated |
| Total assets | ¥960.4 billion | Consolidated |
| Return on equity | 15.8% | Consolidated |
| Equity-to-asset ratio | 35.5% | Consolidated |
| Net income (loss) attributable to owners of parent | ¥45.8 billion | Consolidated |
| Net cash provided by (used in) financing activities | ¥19.8 billion | Consolidated |
| Basic earnings (loss) per share | 275.85 yen | Consolidated |
| Net assets per share | 1,665.94 yen | Consolidated |
| Dividend per share | 75 yen | Parent only |
| Net sales | ¥402.9 billion | Parent only |
| Net income (loss) | ¥29.6 billion | Parent only |
| Total number of issued shares (common stock) | 170,733,525 shares | Parent only |
| Net assets | ¥211.9 billion | Parent only |
| Ordinary income (loss) | ¥28.8 billion | Parent only |
| Total assets | ¥658.7 billion | Parent only |
| Return on equity | 16.4% | Parent only |
| Equity-to-asset ratio | 32.2% | Parent only |
| Capital stock | ¥47.5 billion | Parent only |
| Payout ratio | 43.5% | Parent only |
| Interim dividend per share | 35 yen | Parent only |
| Basic earnings (loss) per share | 172.44 yen | Parent only |
| Net assets per share | 841.07 yen | Parent only |
Employees (10 items)
| Item | Value | Consolidated / Non-consolidated |
|---|---|---|
| Number of employees | 20,626 people | Consolidated |
| Number of employees | 20,626 people | Consolidated |
| Wage gap between men and women (all employees) | 69.7% | Parent only |
| Average length of service (years) | 8.5 years | Parent only |
| Average annual salary | ¥8.30 million | Parent only |
| Average age (years) | 39.4 years old | Parent only |
| Number of employees | 1,129 people | Parent only |
| Number of employees | 1,129 people | Parent only |
| Wage gap between men and women (regular employees) | 73.6% | Parent only |
| Wage gap between men and women (non-regular employees) | 102.8% | Parent only |
Other disclosed items (11 items)
| Item | Value | Consolidated / Non-consolidated |
|---|---|---|
| Net sales to external customers | ¥1,264.1 billion | Consolidated |
| Average number of temporary employees | 76,437 people | Consolidated |
| Average number of temporary employees | 76,437 people | Consolidated |
| Number of associates accounted for using equity method | 1 companies | Consolidated |
| Depreciation | ¥53.3 billion | Consolidated |
| Number of consolidated subsidiaries | 170 companies | Consolidated |
| Rate of male employees taking childcare leave (all employees) | 48.5% | Parent only |
| Average number of temporary employees | 164 people | Parent only |
| Average number of temporary employees | 164 people | Parent only |
| Total return on the share price index | 202.2% | Parent only |
| Ratio of female employees in managerial positions | 13.8% | Parent only |
Shares (12 items)
| Item | Value | Consolidated / Non-consolidated |
|---|---|---|
| Number of shares held | 90,216,000 shares | Consolidated |
| Total number of shares held treasury shares etc | 3,979,500 shares | Consolidated |
| Number of voting rights held | 902,157 units | Consolidated |
| Number of shares | 170,733,525 shares | Consolidated |
| Shareholding ratio treasury shares etc | 2.3% | Consolidated |
| Shareholding ratio | 54.1% | Consolidated |
| Ratio of voting rights held | 57.8% | Consolidated |
| Number of shares held in own name treasury shares etc | 3,979,500 shares | Consolidated |
| Number of voting rights | 1,561,290 units | Consolidated |
| Book value equity securities not listed investment equity securities held for pure investment reporting company | ¥5.00 million | Consolidated |
| Number of issues | 1 issues | Consolidated |
| Total shareholder return | 332.7% | Parent only |
Property and facilities (1 items)
| Item | Value | Consolidated / Non-consolidated |
|---|---|---|
| Capital expenditures | ¥116.5 billion | Consolidated |
Audit (9 items)
| Item | Value | Consolidated / Non-consolidated |
|---|---|---|
| Fees for audit and attestation services - reporting company | ¥87.00 million | Consolidated |
| Fees for audit and attestation services - total | ¥97.00 million | Consolidated |
| Fees for audit and attestation services - total | ¥0.2 billion | Consolidated |
| Fees for audit and attestation services - consolidated subsidiaries | ¥97.00 million | Consolidated |
| Fees for audit and attestation services - consolidated subsidiaries | ¥66.00 million | Consolidated |
| Fees for non-audit services - reporting company | ¥9.00 million | Consolidated |
| Fees for non-audit services - total | ¥15.00 million | Consolidated |
| Fees for non-audit services - total | ¥9.00 million | Consolidated |
| Non audit fees consolidated subsidiaries network firms | ¥15.00 million | Consolidated |
Accounts unique to this company (7 items)
| Item | Value | Consolidated / Non-consolidated |
|---|---|---|
| Revenue | ¥10.1 billion | Consolidated |
| Revenue | ¥5.0 billion | Consolidated |
| Revenue | ¥-0.4 billion | Consolidated |
| Change in average annual salary from the previous year | 1.7% | Parent only |
| Revenue | ¥1.4 billion | Parent only |
| Revenue | ¥9.0 billion | Parent only |
| Revenue | ¥5.0 billion | Parent only |
Balance sheet (154 items)
| Item | Value | Consolidated / Non-consolidated |
|---|---|---|
| Other | ¥6.6 billion | Consolidated |
| Other | ¥7.2 billion | Consolidated |
| Other | ¥72.5 billion | Consolidated |
| Other | ¥31.2 billion | Consolidated |
| Other | ¥6.8 billion | Consolidated |
| Goodwill | ¥10.1 billion | Consolidated |
| Goodwill | ¥10.1 billion | Consolidated |
| Lease obligations | ¥63.2 billion | Consolidated |
| Lease obligations | ¥22.5 billion | Consolidated |
| Lease assets | ¥130.3 billion | Consolidated |
| Lease assets, net | ¥77.6 billion | Consolidated |
| Work in process | ¥3.5 billion | Consolidated |
| Retained earnings | ¥147.1 billion | Consolidated |
| Raw materials and supplies | ¥78.9 billion | Consolidated |
| Merchandise and finished goods | ¥4.8 billion | Consolidated |
| Right of trademark | ¥212.3 billion | Consolidated |
| Non-current liabilities | ¥417.8 billion | Consolidated |
| Non-current assets | ¥640.2 billion | Consolidated |
| Land | ¥37.3 billion | Consolidated |
| Accounts receivable - trade | ¥58.7 billion | Consolidated |
| Accounts receivable - trade | ¥58.7 billion | Consolidated |
| Contract liabilities | ¥0.9 billion | Consolidated |
| Tools, furniture and fixtures | ¥139.5 billion | Consolidated |
| Tools, furniture and fixtures | ¥48.2 billion | Consolidated |
| Guarantee deposits | ¥41.2 billion | Consolidated |
| Buildings and structures | ¥317.9 billion | Consolidated |
| Buildings and structures, net | ¥153.3 billion | Consolidated |
| Construction in progress | ¥8.4 billion | Consolidated |
| Investments and other assets | ¥68.8 billion | Consolidated |
| Investment securities | ¥1.2 billion | Consolidated |
| Securities | ¥15.0 billion | Consolidated |
| Property, plant and equipment | ¥342.1 billion | Consolidated |
| Income taxes payable | ¥9.8 billion | Consolidated |
| Shareholders' equity | ¥301.5 billion | Consolidated |
| Stock issuance cost da | ¥0.3 billion | Consolidated |
| Provision for stocks payment-NCL | ¥0.2 billion | Consolidated |
| Machinery, equipment and vehicles | ¥35.0 billion | Consolidated |
| Machinery, equipment and vehicles, net | ¥17.4 billion | Consolidated |
| Current liabilities | ¥201.1 billion | Consolidated |
| Current assets | ¥319.6 billion | Consolidated |
| Accumulated depreciation | ¥-52.7 billion | Consolidated |
| Accumulated depreciation | ¥-91.4 billion | Consolidated |
| Accumulated depreciation | ¥-164.7 billion | Consolidated |
| Accumulated depreciation | ¥-17.6 billion | Consolidated |
| Foreign currency translation adjustment | ¥39.1 billion | Consolidated |
| Intangible assets | ¥229.3 billion | Consolidated |
| Cash and cash equivalents | ¥128.1 billion | Consolidated |
| Cash and deposits | ¥128.1 billion | Consolidated |
| Short-term loans payable | ¥3.9 billion | Consolidated |
| Bonds payable | ¥50.0 billion | Consolidated |
| Bond issuance cost | ¥0.2 billion | Consolidated |
| Net assets | ¥341.4 billion | Consolidated |
| Net assets | ¥341.4 billion | Consolidated |
| Total assets | ¥960.4 billion | Consolidated |
| Deferred gains or losses on hedges | ¥0.3 billion | Consolidated |
| Deferred tax liabilities | ¥60.6 billion | Consolidated |
| Deferred tax assets | ¥9.2 billion | Consolidated |
| Deferred assets | ¥0.5 billion | Consolidated |
| Treasury stock | ¥-15.6 billion | Consolidated |
| Valuation and translation adjustments | ¥39.4 billion | Consolidated |
| Liabilities | ¥618.9 billion | Consolidated |
| Liabilities and net assets | ¥960.4 billion | Consolidated |
| Accounts payable - trade | ¥58.8 billion | Consolidated |
| Allowance for doubtful accounts | ¥-61.00 million | Consolidated |
| Allowance for doubtful accounts | ¥-0.5 billion | Consolidated |
| Capital surplus | ¥122.6 billion | Consolidated |
| Capital stock | ¥47.5 billion | Consolidated |
| Asset retirement obligations | ¥8.3 billion | Consolidated |
| Provision for bonuses | ¥5.1 billion | Consolidated |
| Net defined benefit liability | ¥0.4 billion | Consolidated |
| Long-term loans payable | ¥228.5 billion | Consolidated |
| Non-controlling interests | ¥0.5 billion | Consolidated |
| Current portion of long-term loans payable | ¥22.6 billion | Consolidated |
| Other | ¥1.1 billion | Parent only |
| Other | ¥0.3 billion | Parent only |
| Other | ¥1.9 billion | Parent only |
| Other | ¥1.0 billion | Parent only |
| Other | ¥0.3 billion | Parent only |
| Other capital surplus | ¥87.7 billion | Parent only |
| Software | ¥5.0 billion | Parent only |
| Lease obligations | ¥11.8 billion | Parent only |
| Lease obligations | ¥1.1 billion | Parent only |
| Lease assets, net | ¥10.1 billion | Parent only |
| Work in process | ¥6.00 million | Parent only |
| Leasehold right | ¥91.00 million | Parent only |
| Provision for loss on guarantees | ¥0.9 billion | Parent only |
| General reserve | ¥3.0 billion | Parent only |
| Retained earnings | ¥45.8 billion | Parent only |
| Legal retained earnings | ¥80.00 million | Parent only |
| Prepaid expenses | ¥5.0 billion | Parent only |
| Advance payments trade | ¥53.00 million | Parent only |
| Raw materials and supplies | ¥0.3 billion | Parent only |
| Merchandise and finished goods | ¥3.5 billion | Parent only |
| Non-current liabilities | ¥323.2 billion | Parent only |
| Non-current assets | ¥409.7 billion | Parent only |
| Land | ¥22.9 billion | Parent only |
| Accounts receivable - trade | ¥39.7 billion | Parent only |
| Contract liabilities | ¥3.4 billion | Parent only |
| Tools, furniture and fixtures | ¥1.8 billion | Parent only |
| Guarantee deposits | ¥26.3 billion | Parent only |
| Buildings, net | ¥10.0 billion | Parent only |
| Construction in progress | ¥2.2 billion | Parent only |
| Investments and other assets | ¥356.2 billion | Parent only |
| Allowance for investment loss | ¥-52.00 million | Parent only |
| Investment securities | ¥5.00 million | Parent only |
| Securities | ¥15.0 billion | Parent only |
| Property, plant and equipment | ¥48.1 billion | Parent only |
| Accounts receivable - other | ¥12.9 billion | Parent only |
| Income taxes payable | ¥0.6 billion | Parent only |
| Accrued expenses | ¥1.4 billion | Parent only |
| Accounts payable - other | ¥4.8 billion | Parent only |
| Shareholders' equity | ¥212.8 billion | Parent only |
| Stock issuance cost da | ¥0.3 billion | Parent only |
| Provision for stocks payment-NCL | ¥0.2 billion | Parent only |
| Structures, net | ¥0.6 billion | Parent only |
| Machinery and equipment, net | ¥0.5 billion | Parent only |
| Current liabilities | ¥123.7 billion | Parent only |
| Current assets | ¥248.5 billion | Parent only |
| Intangible assets | ¥5.4 billion | Parent only |
| Cash and deposits | ¥9.1 billion | Parent only |
| Short-term loans payable | ¥47.4 billion | Parent only |
| Short-term loans receivable with resale agreement | ¥171.0 billion | Parent only |
| Bonds payable | ¥50.0 billion | Parent only |
| Bond issuance cost | ¥0.2 billion | Parent only |
| Net assets | ¥211.9 billion | Parent only |
| Net assets | ¥211.9 billion | Parent only |
| Total assets | ¥658.7 billion | Parent only |
| Deferred gains or losses on hedges | ¥-0.9 billion | Parent only |
| Deferred tax assets | ¥0.8 billion | Parent only |
| Deferred assets | ¥0.5 billion | Parent only |
| Retained earnings brought forward | ¥42.7 billion | Parent only |
| Treasury stock | ¥-15.6 billion | Parent only |
| Valuation and translation adjustments | ¥-0.9 billion | Parent only |
| Liabilities | ¥446.8 billion | Parent only |
| Liabilities and net assets | ¥658.7 billion | Parent only |
| Accounts payable - trade | ¥34.7 billion | Parent only |
| Allowance for doubtful accounts | ¥-0.3 billion | Parent only |
| Allowance for doubtful accounts | ¥-15.6 billion | Parent only |
| Capital surplus | ¥135.2 billion | Parent only |
| Legal capital surplus | ¥47.4 billion | Parent only |
| Capital stock | ¥47.5 billion | Parent only |
| Asset retirement obligations | ¥0.2 billion | Parent only |
| Provision for bonuses | ¥1.8 billion | Parent only |
| Vehicles, net | ¥1.00 million | Parent only |
| Long-term loans payable | ¥225.4 billion | Parent only |
| Long-term prepaid expenses | ¥1.4 billion | Parent only |
| Long-term loans receivable | ¥19.00 million | Parent only |
| Investments in capital of subsidiaries and affiliates | ¥17.8 billion | Parent only |
| Shares of subsidiaries and associates | ¥285.8 billion | Parent only |
| Long-term loans receivable from subsidiaries and affiliates | ¥15.2 billion | Parent only |
| Guarantee deposited-NCL | ¥33.6 billion | Parent only |
| Deposits received | ¥0.3 billion | Parent only |
| Long term borrowings scheduled for collection within the year | ¥5.3 billion | Parent only |
| Current portion of long-term loans payable | ¥21.4 billion | Parent only |
Statement of income (107 items)
| Item | Value | Consolidated / Non-consolidated |
|---|---|---|
| Other | ¥1.8 billion | Consolidated |
| Other | ¥2.8 billion | Consolidated |
| Other | ¥0.1 billion | Consolidated |
| Other | ¥2.6 billion | Consolidated |
| Other comprehensive income | ¥20.6 billion | Consolidated |
| Valuation difference on available for sale securities net of tax | ¥-46.00 million | Consolidated |
| Amortization of goodwill | ¥1.2 billion | Consolidated |
| Loss on withdrawal from business | ¥1.4 billion | Consolidated |
| Dividends from surplus | ¥-12.6 billion | Consolidated |
| Comprehensive income | ¥66.4 billion | Consolidated |
| Interest income | ¥3.0 billion | Consolidated |
| Guaranty money income | ¥0.2 billion | Consolidated |
| Dividend income | ¥12.00 million | Consolidated |
| Operating income | ¥81.4 billion | Consolidated |
| Operating income | ¥81.4 billion | Consolidated |
| Non-operating income | ¥6.6 billion | Consolidated |
| Non-operating expenses | ¥9.8 billion | Consolidated |
| Net cash provided by (used in) operating activities | ¥101.2 billion | Consolidated |
| Loss on sale of non-current assets | ¥0.3 billion | Consolidated |
| Gain on sales of non-current assets | ¥86.00 million | Consolidated |
| Loss on retirement of non-current assets | ¥2.9 billion | Consolidated |
| Rents | ¥64.3 billion | Consolidated |
| Cost of sales | ¥577.6 billion | Consolidated |
| Gross profit (loss) | ¥686.4 billion | Consolidated |
| Net sales | ¥1,264.1 billion | Consolidated |
| Net sales | ¥1,264.1 billion | Consolidated |
| Net income | ¥45.8 billion | Consolidated |
| Net income | ¥45.8 billion | Consolidated |
| Net income (loss) | ¥45.8 billion | Consolidated |
| Net income (loss) | ¥45.8 billion | Consolidated |
| Gain on sales of investment securities | ¥0.1 billion | Consolidated |
| Net cash provided by (used in) investing activities | ¥-78.1 billion | Consolidated |
| Share of profit of investments accounted for using equity method | ¥16.00 million | Consolidated |
| Share of other comprehensive income of investments accounted for using equity method | ¥28.00 million | Consolidated |
| Interest expenses | ¥7.0 billion | Consolidated |
| Issuance of new shares | ¥48.5 billion | Consolidated |
| Provision for dividend | ¥0.4 billion | Consolidated |
| Income taxes - current | ¥21.1 billion | Consolidated |
| Income taxes | ¥22.2 billion | Consolidated |
| Income taxes - deferred | ¥1.1 billion | Consolidated |
| Impairment loss | ¥4.0 billion | Consolidated |
| Impairment loss | ¥4.0 billion | Consolidated |
| Foreign exchange gains | ¥0.9 billion | Consolidated |
| Foreign currency translation adjustment net of tax | ¥19.6 billion | Consolidated |
| Extraordinary income | ¥0.8 billion | Consolidated |
| Extraordinary loss | ¥11.1 billion | Consolidated |
| Effect of exchange rate change on cash and cash equivalents | ¥5.4 billion | Consolidated |
| Net increase (decrease) in cash and cash equivalents | ¥48.3 billion | Consolidated |
| Research and development expenses | ¥0.9 billion | Consolidated |
| Income (loss) before income taxes | ¥68.0 billion | Consolidated |
| Income (loss) before income taxes | ¥68.0 billion | Consolidated |
| Ordinary income | ¥78.3 billion | Consolidated |
| Salaries and allowances | ¥68.2 billion | Consolidated |
| Deferred gains or losses on hedges net of tax | ¥1.1 billion | Consolidated |
| Disposal of treasury stock | ¥0 | Consolidated |
| Purchase of treasury stock | ¥-1.9 billion | Consolidated |
| Subsidy income | ¥0.9 billion | Consolidated |
| Subsidy income | ¥0.2 billion | Consolidated |
| Comprehensive income attributable to owners of parent | ¥66.4 billion | Consolidated |
| Net cash provided by (used in) financing activities | ¥19.8 billion | Consolidated |
| Selling, general and administrative expenses | ¥605.0 billion | Consolidated |
| Provision for bonuses | ¥9.3 billion | Consolidated |
| Retirement benefit expenses | ¥1.1 billion | Consolidated |
| Increase (decrease) in cash and cash equivalents resulting from change in scope of consolidation | ¥99.00 million | Consolidated |
| Change of scope of consolidation | ¥0.7 billion | Consolidated |
| Other salaries | ¥188.4 billion | Consolidated |
| Comprehensive income attributable to non-controlling interests | ¥-13.00 million | Consolidated |
| Net income (loss) attributable to non-controlling interests | ¥-30.00 million | Consolidated |
| Other | ¥0.4 billion | Parent only |
| Other | ¥0.6 billion | Parent only |
| Other | ¥82.00 million | Parent only |
| Other | ¥0.2 billion | Parent only |
| Dividends from surplus | ¥-12.6 billion | Parent only |
| Interest income | ¥3.8 billion | Parent only |
| Dividend income | ¥35.5 billion | Parent only |
| Operating income | ¥-1.5 billion | Parent only |
| Non-operating income | ¥40.0 billion | Parent only |
| Non-operating expenses | ¥9.7 billion | Parent only |
| Loss on retirement of non-current assets | ¥0 | Parent only |
| Cost of sales | ¥375.3 billion | Parent only |
| Gross profit (loss) | ¥27.6 billion | Parent only |
| Net sales | ¥402.9 billion | Parent only |
| Net income (loss) | ¥29.6 billion | Parent only |
| Net income (loss) | ¥29.6 billion | Parent only |
| Interest expenses | ¥4.1 billion | Parent only |
| Commission fees | ¥5.7 billion | Parent only |
| Issuance of new shares | ¥48.5 billion | Parent only |
| Provision for dividend | ¥0.4 billion | Parent only |
| Income taxes - current | ¥-0.7 billion | Parent only |
| Income taxes | ¥-1.0 billion | Parent only |
| Income taxes - deferred | ¥-0.3 billion | Parent only |
| Depreciation | ¥1.0 billion | Parent only |
| Impairment loss | ¥36.00 million | Parent only |
| Foreign exchange gains | ¥0.3 billion | Parent only |
| Extraordinary income | ¥82.00 million | Parent only |
| Extraordinary loss | ¥0.3 billion | Parent only |
| Interest on bonds | ¥0.7 billion | Parent only |
| Income (loss) before income taxes | ¥28.6 billion | Parent only |
| Ordinary income | ¥28.8 billion | Parent only |
| Salaries and allowances | ¥6.8 billion | Parent only |
| Disposal of treasury stock | ¥0 | Parent only |
| Purchase of treasury stock | ¥-1.9 billion | Parent only |
| Selling, general and administrative expenses | ¥29.2 billion | Parent only |
| Provision of allowance for doubtful accounts | ¥3.6 billion | Parent only |
| Provision for bonuses | ¥2.2 billion | Parent only |
| Amortization of long-term prepaid expenses | ¥0.7 billion | Parent only |
| Loss on valuation of shares of subsidiaries and associates | ¥20.00 million | Parent only |
Statement of changes in equity (3 items)
| Item | Value | Consolidated / Non-consolidated |
|---|---|---|
| Total changes during the period | ¥101.1 billion | Consolidated |
| Net changes in items other than shareholders' equity | ¥20.5 billion | Consolidated |
| Total changes during the period | ¥63.6 billion | Parent only |
Statement of cash flows (39 items)
| Item | Value | Consolidated / Non-consolidated |
|---|---|---|
| Other | ¥4.7 billion | Consolidated |
| Other | ¥0.2 billion | Consolidated |
| Other | ¥0.1 billion | Consolidated |
| Increase decrease in other noncurrent liabilities | ¥0.5 billion | Consolidated |
| Decrease increase in other noncurrent assets | ¥2.3 billion | Consolidated |
| Increase (decrease) in other current liabilities | ¥5.8 billion | Consolidated |
| Decrease (increase) in other current assets | ¥2.3 billion | Consolidated |
| Amortization of goodwill | ¥1.2 billion | Consolidated |
| Repayments of lease obligations | ¥-23.6 billion | Consolidated |
| Increase decrease in notes and accounts payable trade | ¥1.2 billion | Consolidated |
| Interest expenses paid | ¥-7.6 billion | Consolidated |
| Interest and dividends income received | ¥3.1 billion | Consolidated |
| Interest and dividend income | ¥-3.0 billion | Consolidated |
| Decrease increase in notes and accounts receivable trade | ¥-2.3 billion | Consolidated |
| Subtotal | ¥134.2 billion | Consolidated |
| Proceeds from collection of guarantee deposits | ¥0.7 billion | Consolidated |
| Payments for guarantee deposits | ¥-2.8 billion | Consolidated |
| Purchase of investment securities | ¥-96.00 million | Consolidated |
| Interest expenses | ¥7.0 billion | Consolidated |
| Proceeds from redemption of securities | ¥60.0 billion | Consolidated |
| Purchase of short term investment securities | ¥-55.0 billion | Consolidated |
| Purchase of property plant and equipment | ¥-78.0 billion | Consolidated |
| Proceeds from sales of property plant and equipment | ¥0.3 billion | Consolidated |
| Decrease in consumption taxes payable | ¥2.6 billion | Consolidated |
| Proceeds from issuance of common stock | ¥48.3 billion | Consolidated |
| Increase (decrease) in provision for share awards | ¥-0.3 billion | Consolidated |
| Decrease (increase) in inventories | ¥-13.3 billion | Consolidated |
| Income taxes paid | ¥-28.5 billion | Consolidated |
| Depreciation | ¥53.3 billion | Consolidated |
| Impairment loss | ¥4.0 billion | Consolidated |
| Purchase of intangible assets | ¥-2.4 billion | Consolidated |
| Decrease/increase in short-term loans payable | ¥-3.3 billion | Consolidated |
| Proceeds from issuance of bonds | ¥19.8 billion | Consolidated |
| Regarding purchase of treasury stock | ¥-1.9 billion | Consolidated |
| Increase (decrease) in provision for bonuses | ¥91.00 million | Consolidated |
| Dividends | ¥-12.6 billion | Consolidated |
| Proceeds from long term loans payable | ¥33.6 billion | Consolidated |
| Repayment of long term loans payable | ¥-40.7 billion | Consolidated |
| Purchase of long-term prepaid expenses | ¥-0.6 billion | Consolidated |
Basic indicators
| Item | Value | Consolidated / Non-consolidated | Source |
|---|---|---|---|
| Net cash provided by (used in) operating activities | ¥101.2 billion | Consolidated | Disclosed |
| Dividend per share | 75 | Parent only | Disclosed |
| Number of employees | 20,626 | Consolidated | Disclosed |
| Net assets | ¥341.4 billion | Consolidated | Disclosed |
| Net sales | ¥1,264.1 billion | Consolidated | Disclosed |
| Operating income | ¥81.4 billion | Consolidated | Disclosed |
| Ordinary income | ¥78.3 billion | Consolidated | Disclosed |
| Net income | ¥45.8 billion | Consolidated | Disclosed |
| Total assets | ¥960.4 billion | Consolidated | Disclosed |
| Operating margin | 6.4% | Consolidated | Calculated |
| Net margin | 3.6% | Consolidated | Calculated |
| Sales per employee | 61284447 yen | Consolidated | Calculated |
| Total asset turnover | 1.32 times | Consolidated | Calculated |
| Net assets to total assets | 35.6% | Consolidated | Calculated |