Nippon Television
Nippon Television Holdings, Inc.
Company highlights
A company that sells the same programme twice.
Vol.6, Chapter 5 (as of 2026-08-26)
Key figures
Period Apr 2025 to Mar 2026ConsolidatedJapanese GAAP
Business revenue model
Featured in
Vol.6, Chapter 5 (as of 2026-08-26)
“Kaisha no Shikumi: Free”, Chapter 5: Nippon TV: Terrestrial Advertising Fell from 64.7% to 51.2% of External Sales
Book’s reference date 2026-08-26 / data last checked 2026-10-20
Key points in this volumeA free service's profits depend not just on how many people use it, but on who pays.
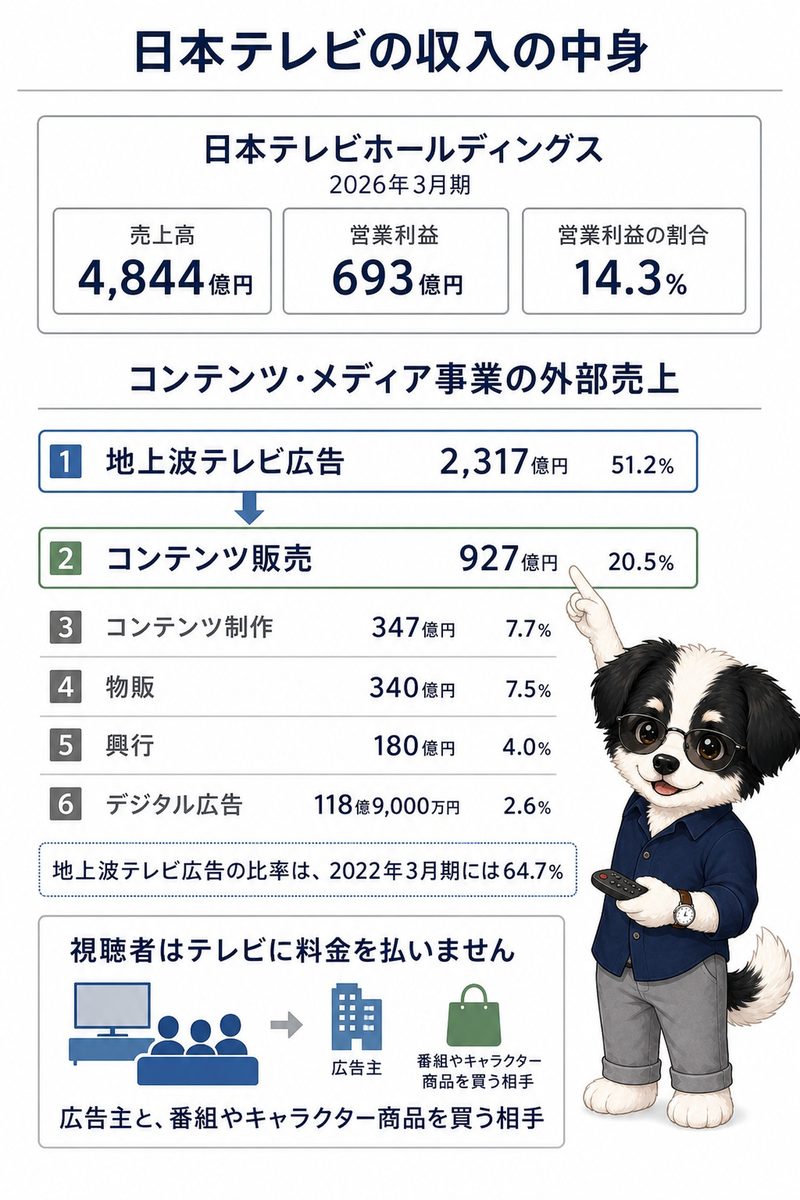
For the year ended March 2026, net sales were ¥484.4 billion and operating income ¥69.3 billion. Terrestrial advertising was ¥231.7 billion, and remains the largest single source of income.
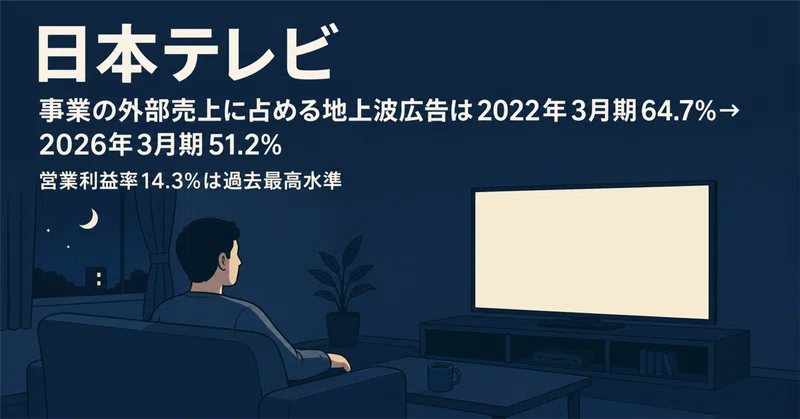
What changed is its share, which fell from 64.7% to 51.2%. The amount is flat, so the fall came from other lines growing. What grew is content sales at ¥92.7 billion: programmes broadcast free are sold on again to streaming services, other broadcasters and overseas buyers.
The move that changed Nippon TV
Nippon TV made Studio Ghibli a consolidated subsidiary, adding a business that owns the works to the business of selling airtime.
In September 2023 Nippon TV announced the purchase of shares in Studio Ghibli, and in October it acquired 42.3% of the voting rights and made it a consolidated subsidiary. The purchase price is not disclosed. In the external sales of the Content & Media business in the year ended March 2026, content sales were ¥92.748 billion ($580 million) at 20.5%, content production ¥34.747 billion at 7.7%, merchandise ¥34.047 billion at 7.5%, and live events ¥17.985 billion at 4.0%. Terrestrial TV advertising went from 64.7% of that total in the year ended March 2022 to 51.2% in the year ended March 2026. In 2026 the company made KANAMEL a wholly owned subsidiary at an acquisition cost of ¥49.75 billion.
Coverage in the book
- Terrestrial Advertising Is 51.2% of External Sales
- Advertising Attached to a Programme, and Advertising Shown in the Breaks
- How Much the Lines Outside Terrestrial Come To
- Digital Advertising Is ¥11.890 Billion
- The Cost of Keeping the Broadcasts Free Arises Every Year
Related books, articles and videos
 “Kaisha no Shikumi: Free”
Chapter 5: Nippon Television
“Nippon TV: Terrestrial Advertising Fell from 64.7% to 51.2% of External Sales”
“Ano Kaisha no Shikumi” series, Vol.6 — Kindle and paperback
Find it on Amazon →

Company profile
Tables scroll sideways
Disclosed data
Business activities and revenue composition
Nippon Television
Revenue and profit by business segment
Period Apr 2025 to Mar 2026Source Annual securities reportsConsolidated・Disclosed
| Business | Net sales to external customers | Operating income | ||||
|---|---|---|---|---|---|---|
| This year | Share | Last year | This year | Margin | Last year | |
| Content Media Business | ¥452.7 billion | 93.4% | ¥430.9 billion | ¥67.1 billion | 14.8% | ¥52.2 billion |
| Wellness Business | ¥27.2 billion | 5.6% | ¥26.4 billion | ¥-72.00 million | -0.3% | ¥0.2 billion |
| Real estate related business | ¥4.6 billion | 0.9% | ¥4.6 billion | ¥4.1 billion | 90.7% | ¥4.4 billion |
| Total of the businesses | ¥484.4 billion | 100.0% | ||||
Revenue and profit
Nippon Television
Period Apr 2025 to Mar 2026Source Annual securities reports
Amounts by account
| Group | Account | Amount | Consolidated / Non-consolidated |
|---|---|---|---|
| Selling, general and administrative expenses | Agent fees | ¥45.0 billion | Consolidated |
| Other | ¥43.0 billion | Consolidated | |
| Personnel expenses | ¥23.2 billion | Consolidated | |
| General and administrative expenses | ¥4.1 billion | Parent only | |
| Amortization of goodwill | ¥0.8 billion | Consolidated | |
| Retirement benefit expenses | ¥0.3 billion | Consolidated | |
| Research and development expenses | ¥0.2 billion | Consolidated | |
| Profit by stage | Gross profit (loss) | ¥180.9 billion | Consolidated |
| Ordinary income | ¥82.1 billion | Consolidated | |
| Operating income | ¥69.3 billion | Consolidated | |
| Net income | ¥56.8 billion | Consolidated |
Nippon Television
Selling, general and administrative expenses
Period Apr 2025 to Mar 2026Source Annual securities reports
- Agent fees ¥45.0 billion
- Other ¥43.0 billion
- Personnel expenses ¥23.2 billion
- General and administrative expenses ¥4.1 billion
- Amortization of goodwill ¥0.8 billion
- Retirement benefit expenses ¥0.3 billion
Performance, financial position and capital allocation
Long-term changes in performance
Nippon Television
Long-term revenue, profit and asset trends
Period 2013 to 2026Source Annual securities reportsDisclosed
Nippon Television
Recent performance trends
Source Annual securities reports
Year-on-year comparison
| Item | 2022 | 2023 | 2024 | 2025 | 2026 |
|---|---|---|---|---|---|
| Net sales | ¥406.4B | ¥414.0B | ¥423.5B | ¥461.9B | ¥484.4B |
| Year on year (%) | +3.8% | +1.9% | +2.3% | +9.1% | +4.9% |
| Ordinary income (loss) | ¥64.8B | ¥51.8B | ¥49.5B | ¥65.7B | ¥82.1B |
| Change from prior year | +51.0% | -20.1% | -4.4% | +32.8% | +24.9% |
| Ordinary income (loss) as a share of Net sales | 16.0% | 12.5% | 11.7% | 14.2% | 16.9% |
| Change (percentage points) | +5.0 points◆ | -3.4 points◆ | -0.8 points | +2.5 points◆ | +2.7 points◆ |
Fiscal periods marked for changes
Earlier fiscal periods (1)
- 2022Ordinary income (loss) as a share of revenue +5.0 points
- 2023Ordinary income (loss) as a share of revenue -3.4 points
- 2025Ordinary income (loss) as a share of revenue +2.5 points
- 2026Ordinary income (loss) as a share of revenue +2.7 points
Nippon Television
Earnings and net assets per share over time
Unit yenSource Annual securities reports
Nippon Television
Return on equity over time
Unit %Source Annual securities reports
Consolidated indicators (15 items)
| Item | 4 years ago | 3 years ago | 2 years ago | Last year | This year |
|---|---|---|---|---|---|
| Net sales | ¥406.4 billion | ¥414.0 billion | ¥423.5 billion | ¥461.9 billion | ¥484.4 billion |
| Ordinary income (loss) | ¥64.8 billion | ¥51.8 billion | ¥49.5 billion | ¥65.7 billion | ¥82.1 billion |
| Net income (loss) attributable to owners of parent | ¥47.4 billion | ¥34.1 billion | ¥34.7 billion | ¥46.0 billion | ¥56.8 billion |
| Comprehensive income | ¥38.3 billion | ¥1.5 billion | ¥98.1 billion | ¥58.3 billion | ¥64.2 billion |
| Net assets | ¥850.8 billion | ¥843.6 billion | ¥947.3 billion | ¥991.0 billion | ¥1,031.1 billion |
| Total assets | ¥1,061.6 billion | ¥1,035.5 billion | ¥1,183.3 billion | ¥1,232.1 billion | ¥1,282.6 billion |
| Net assets per share | 3,311.63 yen | 3,280.35 yen | 3,645.65 yen | 3,833.19 yen | 4,021.88 yen |
| Basic earnings (loss) per share | 185.95 yen | 133.61 yen | 136.41 yen | 183.42 yen | 228.07 yen |
| Diluted earnings per share | 185.66 yen | 133.28 yen | 136.18 yen | 183.37 yen | 225.98 yen |
| Equity-to-asset ratio | 79.6% | 80.8% | 77.6% | 77.9% | 77.6% |
| Return on equity | 5.7% | 4.1% | 3.9% | 4.9% | 5.8% |
| Net cash provided by (used in) operating activities | ¥58.5 billion | ¥45.5 billion | ¥44.7 billion | ¥47.9 billion | ¥60.8 billion |
| Net cash provided by (used in) investing activities | ¥-70.5 billion | ¥-23.7 billion | ¥7.5 billion | ¥-26.4 billion | ¥-27.5 billion |
| Net cash provided by (used in) financing activities | ¥-9.4 billion | ¥-9.5 billion | ¥-15.0 billion | ¥-16.1 billion | ¥-20.8 billion |
| Cash and cash equivalents | ¥62.4 billion | ¥74.9 billion | ¥112.5 billion | ¥118.2 billion | ¥129.6 billion |
Parent only indicators (14 items)
| Item | 4 years ago | 3 years ago | 2 years ago | Last year | This year |
|---|---|---|---|---|---|
| Net sales | ¥13.8 billion | ¥14.9 billion | ¥15.3 billion | ¥15.3 billion | ¥15.8 billion |
| Ordinary income (loss) | ¥10.5 billion | ¥11.8 billion | ¥11.6 billion | ¥10.2 billion | ¥10.8 billion |
| Net income (loss) | ¥4.0 billion | ¥7.8 billion | ¥0.5 billion | ¥7.1 billion | ¥6.9 billion |
| Capital stock | ¥18.6 billion | ¥18.6 billion | ¥18.6 billion | ¥18.6 billion | ¥18.6 billion |
| Total number of issued shares (common stock) | 263,822,080 shares | 263,822,080 shares | 263,822,080 shares | 263,822,080 shares | 261,220,180 shares |
| Net assets | ¥337.1 billion | ¥335.6 billion | ¥320.7 billion | ¥314.7 billion | ¥302.3 billion |
| Total assets | ¥584.0 billion | ¥560.4 billion | ¥571.1 billion | ¥533.0 billion | ¥577.6 billion |
| Net assets per share | 1,293.84 yen | 1,288.13 yen | 1,245.85 yen | 1,228.06 yen | 1,190.02 yen |
| Dividend per share | 37 yen | 37 yen | 40 yen | 40 yen | 45 yen |
| Interim dividend per share | 10 yen | 10 yen | 10 yen | 10 yen | 10 yen |
| Basic earnings (loss) per share | 15.26 yen | 29.84 yen | 1.91 yen | 27.7 yen | 27.04 yen |
| Equity-to-asset ratio | 57.7% | 59.9% | 56.1% | 59.0% | 52.3% |
| Return on equity | 1.2% | 2.3% | 0.2% | 2.2% | 2.2% |
| Payout ratio | 242.5% | 124.0% | 2,084.3% | 144.4% | 166.4% |
Dividend history
| Fiscal year | Annual dividend per share | Of which interim | Payout ratio (as reported, parent only) | Flag |
|---|---|---|---|---|
| FY ending 3/2026 | ¥45 | ¥10 | 166.4% | |
| FY ending 3/2025 | ¥40 | ¥10 | 144.4% | |
| FY ending 3/2024 | ¥40 | ¥10 | 2,084.3% | |
| FY ending 3/2023 | ¥37 | ¥10 | 124.0% | |
| FY ending 3/2022 | ¥37 | ¥10 | 242.5% | |
| FY ending 3/2021 | ¥35 | ¥10 | Could not be retrieved | |
| FY ending 3/2020 | ¥35 | ¥10 | 351.0% | |
| FY ending 3/2019 | ¥35 | ¥10 | 280.9% | |
| FY ending 3/2018 | ¥34 | ¥10 | 292.3% | |
| FY ending 3/2017 | ¥34 | ¥10 | 249.8% | |
| FY ending 3/2016 | ¥34 | ¥10 | 32.8% | |
| FY ending 3/2015 | ¥30 | ¥10 | 199.5% | |
| FY ending 3/2014 | ¥34 | ¥9 | 229.7% | |
| FY ending 3/2013 | ¥110 | ¥90 | 90.0% | Stock split or share consolidation noted |
Nippon Television
Dividends per share over time
Unit yenSource Annual securities reports
Shareholder composition
Share ownership by holder category
Nippon Television
Unit %Source Annual securities reports
- Financial institutions13.68%
- Securities firms0.53%
- Other corporations51.38%
- Foreign holders (institutions)17.68%
- Foreign holders (individuals)0.01%
- Individuals and others16.69%
Major shareholders
| Rank | Shareholder | Shareholding ratio | Shares held |
|---|---|---|---|
| 1 | 株式会社読売新聞グループ本社 | 14.76% | 37,649,480 |
| 2 | 日本マスタートラスト信託銀行株式会社(信託口) | 9.04% | 23,061,700 |
| 3 | STATE STREET BANK AND TRUSTCOMPANY 505001(常任代理人 株式会社みずほ銀行決済営業部) | 8.45% | 21,558,305 |
| 4 | 読売テレビ放送株式会社 | 6.72% | 17,133,160 |
| 5 | 株式会社読売新聞東京本社 | 6.25% | 15,939,700 |
| 6 | 学校法人帝京大学 | 3.77% | 9,623,720 |
| 7 | 株式会社NTTドコモ | 3.05% | 7,779,000 |
| 8 | 株式会社よみうりランド | 2.05% | 5,236,000 |
| 9 | 中京テレビ放送株式会社 | 2.05% | 5,229,680 |
| 10 | 株式会社リクルートホールディングス | 2.02% | 5,160,000 |
Research and development expenses and capital expenditure
| Fiscal year | Capital expenditure |
|---|---|
| FY ending 3/2026 | ¥13.1 billion |
| FY ending 3/2021 | ¥13.2 billion |
Revenue scale in the same industry
Nippon Television
Source Annual securities reports of each company
Information and Communication: 642 companies · revenue · largest first・each company’s latest fiscal year・Consolidated・Disclosed
- 1 NTTFY Mar 2026 ¥14.4T
- 2 SoftBank GroupFY Mar 2026 ¥7.8T
- 3 ソフトバンクFY Mar 2026 ¥7.0T
- … 8 companies
- 12 FUJI MEDIAFY Mar 2026 ¥551.9B
- 13 KONAMI GROUPFY Mar 2026 ¥493.7B
- 14 Nippon TelevisionThis companyFY Mar 2026 ¥484.4B
- 15 NEXONFY Dec 2025 ¥475.1B
- 16 BIPROGYFY Mar 2026 ¥433.7B
- … 626 companies
Workforce information
Audit and disclosure information
| Item | Value |
|---|---|
| Audit firm | EY新日本有限責任監査法人 |
| Audit fees (this year, total) | ¥0.1 billion |
| Non-audit fees (this year, total) | Not applicable |
| Going concern note | Cannot be determined |
| Accounting standard | Japanese GAAP |
Sources and methodology
Retrieved disclosed figures
Major management indicators (5 years) (29 items)
| Item | Value | Consolidated / Non-consolidated |
|---|---|---|
| Comprehensive income | ¥64.2 billion | Consolidated |
| Net cash provided by (used in) operating activities | ¥60.8 billion | Consolidated |
| Net sales | ¥484.4 billion | Consolidated |
| Net cash provided by (used in) investing activities | ¥-27.5 billion | Consolidated |
| Diluted earnings per share | 225.98 yen | Consolidated |
| Cash and cash equivalents | ¥129.6 billion | Consolidated |
| Net assets | ¥1,031.1 billion | Consolidated |
| Ordinary income (loss) | ¥82.1 billion | Consolidated |
| Total assets | ¥1,282.6 billion | Consolidated |
| Return on equity | 5.8% | Consolidated |
| Equity-to-asset ratio | 77.6% | Consolidated |
| Net income (loss) attributable to owners of parent | ¥56.8 billion | Consolidated |
| Net cash provided by (used in) financing activities | ¥-20.8 billion | Consolidated |
| Basic earnings (loss) per share | 228.07 yen | Consolidated |
| Net assets per share | 4,021.88 yen | Consolidated |
| Dividend per share | 45 yen | Parent only |
| Net sales | ¥15.8 billion | Parent only |
| Net income (loss) | ¥6.9 billion | Parent only |
| Total number of issued shares (common stock) | 261,220,180 shares | Parent only |
| Net assets | ¥302.3 billion | Parent only |
| Ordinary income (loss) | ¥10.8 billion | Parent only |
| Total assets | ¥577.6 billion | Parent only |
| Return on equity | 2.2% | Parent only |
| Equity-to-asset ratio | 52.3% | Parent only |
| Capital stock | ¥18.6 billion | Parent only |
| Payout ratio | 166.4% | Parent only |
| Interim dividend per share | 10 yen | Parent only |
| Basic earnings (loss) per share | 27.04 yen | Parent only |
| Net assets per share | 1,190.02 yen | Parent only |
Employees (8 items)
| Item | Value | Consolidated / Non-consolidated |
|---|---|---|
| Number of employees | 5,933 people | Consolidated |
| Number of employees | 5,933 people | Consolidated |
| Average length of service (years) | 17 years | Parent only |
| Average annual salary | ¥13.98 million | Parent only |
| Average age (years) | 48.6 years old | Parent only |
| Number of employees | 235 people | Parent only |
| Number of employees | 235 people | Parent only |
| Number of employees | 235 people | Parent only |
Other disclosed items (9 items)
| Item | Value | Consolidated / Non-consolidated |
|---|---|---|
| Net sales to external customers | ¥484.4 billion | Consolidated |
| Average number of temporary employees | 5,371 people | Consolidated |
| Average number of temporary employees | 5,371 people | Consolidated |
| Number of associates accounted for using equity method | 33 companies | Consolidated |
| Number of unconsolidated subsidiaries accounted for using equity method | 38 companies | Consolidated |
| Write-downs of inventories | ¥0.8 billion | Consolidated |
| Depreciation | ¥12.3 billion | Consolidated |
| Number of consolidated subsidiaries | 22 companies | Consolidated |
| Total return on the share price index | 202.2% | Parent only |
Shares (24 items)
| Item | Value | Consolidated / Non-consolidated |
|---|---|---|
| Number of shares held | 148,370,745 shares | Consolidated |
| Total number of shares held treasury shares etc | 6,267,400 shares | Consolidated |
| Number of issues whose number of shares increased shares not listed investment shares held for purposes other than pure investment largest holding company | 1 issues | Consolidated |
| Number of issues whose number of shares increased shares other than those not listed investment shares held for purposes other than pure investment reporting company | 1 issues | Consolidated |
| Number of issues whose number of shares increased shares other than those not listed investment shares held for purposes other than pure investment largest holding company | 1 issues | Consolidated |
| Number of issues whose number of shares decreased shares other than those not listed investment shares held for purposes other than pure investment largest holding company | 1 issues | Consolidated |
| Total acquisition cost for increased shares shares not listed investment shares held for purposes other than pure investment largest holding company | ¥0.1 billion | Consolidated |
| Total acquisition cost for increased shares shares other than those not listed investment shares held for purposes other than pure investment reporting company | ¥0.4 billion | Consolidated |
| Total acquisition cost for increased shares shares other than those not listed investment shares held for purposes other than pure investment largest holding company | ¥1.00 million | Consolidated |
| Total sale amount for decreased shares shares other than those not listed investment shares held for purposes other than pure investment largest holding company | ¥8.7 billion | Consolidated |
| Number of shares | 261,220,180 shares | Consolidated |
| Shareholding ratio treasury shares etc | 2.4% | Consolidated |
| Shareholding ratio | 58.2% | Consolidated |
| Number of shares held in own name treasury shares etc | 6,267,400 shares | Consolidated |
| Number of voting rights | 2,311,304 units | Consolidated |
| Carrying amount on the balance sheet | ¥0.4 billion | Consolidated |
| Carrying amount on the balance sheet | ¥9.7 billion | Consolidated |
| Carrying amount on the balance sheet | ¥0.4 billion | Consolidated |
| Carrying amount on the balance sheet | ¥256.5 billion | Consolidated |
| Number of issues | 3 issues | Consolidated |
| Number of issues | 55 issues | Consolidated |
| Number of issues | 1 issues | Consolidated |
| Number of issues | 18 issues | Consolidated |
| Total shareholder return | 230.8% | Parent only |
Property and facilities (1 items)
| Item | Value | Consolidated / Non-consolidated |
|---|---|---|
| Capital expenditures | ¥13.1 billion | Consolidated |
Audit (3 items)
| Item | Value | Consolidated / Non-consolidated |
|---|---|---|
| Fees for audit and attestation services - reporting company | ¥44.00 million | Consolidated |
| Fees for audit and attestation services - total | ¥0.1 billion | Consolidated |
| Fees for audit and attestation services - consolidated subsidiaries | ¥56.00 million | Consolidated |
Accounts unique to this company (12 items)
| Item | Value | Consolidated / Non-consolidated |
|---|---|---|
| Revenue | ¥7.4 billion | Consolidated |
| Revenue | ¥-0.7 billion | Consolidated |
| Revenue | ¥-1.7 billion | Consolidated |
| Revenue | ¥-0.3 billion | Consolidated |
| Revenue | ¥-1.2 billion | Consolidated |
| Change in average annual salary from the previous year | 0.6% | Parent only |
| Revenue | ¥87.00 million | Parent only |
| Revenue | ¥4.00 million | Parent only |
| Revenue | ¥4.1 billion | Parent only |
| Revenue | ¥0.1 billion | Parent only |
| Revenue | ¥2.4 billion | Parent only |
| Revenue | ¥1.7 billion | Parent only |
Balance sheet (112 items)
| Item | Value | Consolidated / Non-consolidated |
|---|---|---|
| Other | ¥11.9 billion | Consolidated |
| Other | ¥23.4 billion | Consolidated |
| Other | ¥22.6 billion | Consolidated |
| Other | ¥27.1 billion | Consolidated |
| Other | ¥19.1 billion | Consolidated |
| Valuation difference on available-for-sale securities | ¥160.3 billion | Consolidated |
| Goodwill | ¥9.0 billion | Consolidated |
| Goodwill | ¥9.0 billion | Consolidated |
| Lease obligations | ¥4.8 billion | Consolidated |
| Lease assets, net | ¥1.1 billion | Consolidated |
| Work in process | ¥1.8 billion | Consolidated |
| Retained earnings | ¥805.6 billion | Consolidated |
| Raw materials and supplies | ¥0.3 billion | Consolidated |
| Notes receivable - trade | ¥92.00 million | Consolidated |
| Notes receivable - trade | ¥120.5 billion | Consolidated |
| Merchandise and finished goods | ¥3.6 billion | Consolidated |
| Non-current liabilities | ¥122.3 billion | Consolidated |
| Non-current assets | ¥903.1 billion | Consolidated |
| Land | ¥179.8 billion | Consolidated |
| Accounts receivable - trade | ¥119.6 billion | Consolidated |
| Contract liabilities | ¥10.4 billion | Consolidated |
| Contract assets | ¥0.8 billion | Consolidated |
| Tools, furniture and fixtures | ¥3.1 billion | Consolidated |
| Buildings and structures, net | ¥57.5 billion | Consolidated |
| Construction in progress | ¥6.6 billion | Consolidated |
| Investments and other assets | ¥620.6 billion | Consolidated |
| Investment securities | ¥591.4 billion | Consolidated |
| Securities | ¥123.0 billion | Consolidated |
| Property, plant and equipment | ¥254.4 billion | Consolidated |
| Income taxes payable | ¥15.1 billion | Consolidated |
| Accrued expenses | ¥64.2 billion | Consolidated |
| Accounts payable - other | ¥9.8 billion | Consolidated |
| Shareholders' equity | ¥834.1 billion | Consolidated |
| Inventories | ¥5.7 billion | Consolidated |
| Inventories | ¥5.7 billion | Consolidated |
| Machinery, equipment and vehicles, net | ¥6.1 billion | Consolidated |
| Current liabilities | ¥129.2 billion | Consolidated |
| Current assets | ¥379.5 billion | Consolidated |
| Accumulated depreciation | ¥-8.5 billion | Consolidated |
| Accumulated depreciation | ¥-10.6 billion | Consolidated |
| Accumulated depreciation | ¥-81.6 billion | Consolidated |
| Accumulated depreciation | ¥-174.5 billion | Consolidated |
| Accumulated depreciation | ¥-73.9 billion | Consolidated |
| Foreign currency translation adjustment | ¥0.5 billion | Consolidated |
| Intangible assets | ¥28.1 billion | Consolidated |
| Cash and cash equivalents | ¥129.6 billion | Consolidated |
| Cash and deposits | ¥96.2 billion | Consolidated |
| Short-term loans payable | ¥3.8 billion | Consolidated |
| Net assets | ¥1,031.1 billion | Consolidated |
| Net assets | ¥1,031.1 billion | Consolidated |
| Total assets | ¥1,282.6 billion | Consolidated |
| Deferred gains or losses on hedges | ¥19.00 million | Consolidated |
| Deferred tax liabilities | ¥71.4 billion | Consolidated |
| Deferred tax assets | ¥4.0 billion | Consolidated |
| Treasury stock | ¥-25.3 billion | Consolidated |
| Valuation and translation adjustments | ¥160.8 billion | Consolidated |
| Liabilities | ¥251.5 billion | Consolidated |
| Liabilities and net assets | ¥1,282.6 billion | Consolidated |
| Accounts payable - trade | ¥13.8 billion | Consolidated |
| Allowance for doubtful accounts | ¥-0.2 billion | Consolidated |
| Allowance for doubtful accounts | ¥-0.4 billion | Consolidated |
| Capital surplus | ¥35.3 billion | Consolidated |
| Capital stock | ¥18.6 billion | Consolidated |
| Net defined benefit liability | ¥12.9 billion | Consolidated |
| Long-term loans receivable | ¥2.0 billion | Consolidated |
| Long term guarantee deposited | ¥21.2 billion | Consolidated |
| Non-controlling interests | ¥36.1 billion | Consolidated |
| Other | ¥67.00 million | Parent only |
| Other | ¥1.2 billion | Parent only |
| Other | ¥3.0 billion | Parent only |
| Valuation difference on available-for-sale securities | ¥0.5 billion | Parent only |
| General reserve | ¥250.0 billion | Parent only |
| Retained earnings | ¥271.2 billion | Parent only |
| Legal retained earnings | ¥3.5 billion | Parent only |
| Advances received | ¥0.6 billion | Parent only |
| Prepaid expenses | ¥93.00 million | Parent only |
| Non-current liabilities | ¥20.8 billion | Parent only |
| Non-current assets | ¥474.2 billion | Parent only |
| Reserve for advanced depreciation of noncurrent assets | ¥9.5 billion | Parent only |
| Land | ¥101.0 billion | Parent only |
| Accounts receivable - trade | ¥0.5 billion | Parent only |
| Investments and other assets | ¥373.1 billion | Parent only |
| Investment securities | ¥111.4 billion | Parent only |
| Securities | ¥88.0 billion | Parent only |
| Property, plant and equipment | ¥101.0 billion | Parent only |
| Consumption taxes receivable | ¥81.00 million | Parent only |
| Income taxes payable | ¥56.00 million | Parent only |
| Accrued expenses | ¥0.4 billion | Parent only |
| Accounts payable - other | ¥27.00 million | Parent only |
| Shareholders' equity | ¥301.8 billion | Parent only |
| Current liabilities | ¥254.5 billion | Parent only |
| Current assets | ¥103.4 billion | Parent only |
| Cash and deposits | ¥11.8 billion | Parent only |
| Short-term loans payable | ¥252.2 billion | Parent only |
| Net assets | ¥302.3 billion | Parent only |
| Net assets | ¥302.3 billion | Parent only |
| Total assets | ¥577.6 billion | Parent only |
| Deferred tax liabilities | ¥0.4 billion | Parent only |
| Retained earnings brought forward | ¥8.1 billion | Parent only |
| Treasury stock | ¥-17.6 billion | Parent only |
| Valuation and translation adjustments | ¥0.5 billion | Parent only |
| Liabilities | ¥275.3 billion | Parent only |
| Liabilities and net assets | ¥577.6 billion | Parent only |
| Allowance for doubtful accounts | ¥-21.5 billion | Parent only |
| Capital surplus | ¥29.6 billion | Parent only |
| Legal capital surplus | ¥29.6 billion | Parent only |
| Capital stock | ¥18.6 billion | Parent only |
| Long term guarantee deposited | ¥19.0 billion | Parent only |
| Provision for loss on business of subsidiaries and affiliates | ¥1.4 billion | Parent only |
| Shares of subsidiaries and associates | ¥253.6 billion | Parent only |
| Long-term loans receivable from subsidiaries and affiliates | ¥29.6 billion | Parent only |
| Deposits received | ¥12.00 million | Parent only |
Statement of income (94 items)
| Item | Value | Consolidated / Non-consolidated |
|---|---|---|
| Other | ¥0.8 billion | Consolidated |
| Other | ¥0.1 billion | Consolidated |
| Other | ¥0.6 billion | Consolidated |
| Other | ¥0.2 billion | Consolidated |
| Other | ¥43.0 billion | Consolidated |
| Other comprehensive income | ¥2.5 billion | Consolidated |
| Valuation difference on available for sale securities net of tax | ¥2.1 billion | Consolidated |
| Amortization of goodwill | ¥0.8 billion | Consolidated |
| Personnel expenses | ¥23.2 billion | Consolidated |
| Agent fees | ¥45.0 billion | Consolidated |
| Dividends from surplus | ¥-10.3 billion | Consolidated |
| Comprehensive income | ¥64.2 billion | Consolidated |
| Interest income | ¥3.1 billion | Consolidated |
| Dividend income | ¥3.1 billion | Consolidated |
| Operating income | ¥69.3 billion | Consolidated |
| Operating income | ¥69.3 billion | Consolidated |
| Non-operating income | ¥13.6 billion | Consolidated |
| Non-operating expenses | ¥0.8 billion | Consolidated |
| Net cash provided by (used in) operating activities | ¥60.8 billion | Consolidated |
| Loss on sale of non-current assets | ¥1.00 million | Consolidated |
| Gain on sales of non-current assets | ¥0 | Consolidated |
| Loss on retirement of non-current assets | ¥0.3 billion | Consolidated |
| Cost of sales | ¥303.5 billion | Consolidated |
| Gross profit (loss) | ¥180.9 billion | Consolidated |
| Net sales | ¥484.4 billion | Consolidated |
| Net sales | ¥484.4 billion | Consolidated |
| Net income | ¥56.8 billion | Consolidated |
| Net income | ¥56.8 billion | Consolidated |
| Net income (loss) | ¥61.8 billion | Consolidated |
| Net income (loss) | ¥61.8 billion | Consolidated |
| Loss on investments in partnership | ¥0.5 billion | Consolidated |
| Gain on investments in partnership | ¥1.0 billion | Consolidated |
| Gain on sales of investment securities | ¥8.3 billion | Consolidated |
| Loss on valuation of investment securities | ¥0.3 billion | Consolidated |
| Net cash provided by (used in) investing activities | ¥-27.5 billion | Consolidated |
| Share of profit of investments accounted for using equity method | ¥5.4 billion | Consolidated |
| Change in treasury shares arising from change in equity in entities accounted for using equity method | ¥-3.5 billion | Consolidated |
| Share of other comprehensive income of investments accounted for using equity method | ¥0.4 billion | Consolidated |
| Interest expenses | ¥0.2 billion | Consolidated |
| Income taxes - current | ¥25.8 billion | Consolidated |
| Income taxes | ¥25.3 billion | Consolidated |
| Income taxes - deferred | ¥-0.5 billion | Consolidated |
| Impairment loss | ¥3.2 billion | Consolidated |
| Impairment loss | ¥3.2 billion | Consolidated |
| Foreign exchange gains | ¥0.2 billion | Consolidated |
| Foreign currency translation adjustment net of tax | ¥11.00 million | Consolidated |
| Extraordinary income | ¥8.9 billion | Consolidated |
| Extraordinary loss | ¥4.0 billion | Consolidated |
| Effect of exchange rate change on cash and cash equivalents | ¥15.00 million | Consolidated |
| Net increase (decrease) in cash and cash equivalents | ¥12.5 billion | Consolidated |
| Research and development expenses | ¥0.2 billion | Consolidated |
| Income (loss) before income taxes | ¥87.0 billion | Consolidated |
| Income (loss) before income taxes | ¥87.0 billion | Consolidated |
| Ordinary income | ¥82.1 billion | Consolidated |
| Disposal of treasury stock | ¥0.6 billion | Consolidated |
| Purchase of treasury stock | ¥-10.0 billion | Consolidated |
| Comprehensive income attributable to owners of parent | ¥59.3 billion | Consolidated |
| Net cash provided by (used in) financing activities | ¥-20.8 billion | Consolidated |
| Selling, general and administrative expenses | ¥111.6 billion | Consolidated |
| Selling, general and administrative expenses | ¥111.6 billion | Consolidated |
| Retirement benefit expenses | ¥0.3 billion | Consolidated |
| Comprehensive income attributable to non-controlling interests | ¥5.0 billion | Consolidated |
| Net income (loss) attributable to non-controlling interests | ¥5.0 billion | Consolidated |
| Other | ¥0.3 billion | Parent only |
| Other | ¥85.00 million | Parent only |
| General and administrative expenses | ¥4.1 billion | Parent only |
| Rent income of real estate | ¥3.8 billion | Parent only |
| Rent expenses on real estates | ¥1.5 billion | Parent only |
| Dividends from surplus | ¥-10.3 billion | Parent only |
| Interest income | ¥0.3 billion | Parent only |
| Dividend income | ¥0.7 billion | Parent only |
| Operating income | ¥10.1 billion | Parent only |
| Operating revenue | ¥15.8 billion | Parent only |
| Non-operating income | ¥3.3 billion | Parent only |
| Non-operating expenses | ¥2.6 billion | Parent only |
| Operating expenses | ¥5.7 billion | Parent only |
| Net income (loss) | ¥6.9 billion | Parent only |
| Net income (loss) | ¥6.9 billion | Parent only |
| Loss on valuation of investment securities | ¥26.00 million | Parent only |
| Interest expenses | ¥2.4 billion | Parent only |
| Interest on securities | ¥2.0 billion | Parent only |
| Income taxes - current | ¥0.4 billion | Parent only |
| Income taxes | ¥0.4 billion | Parent only |
| Income taxes - deferred | ¥-8.00 million | Parent only |
| Extraordinary loss | ¥3.5 billion | Parent only |
| Income (loss) before income taxes | ¥7.3 billion | Parent only |
| Consulting fee income | ¥2.1 billion | Parent only |
| Ordinary income | ¥10.8 billion | Parent only |
| Disposal of treasury stock | ¥0.6 billion | Parent only |
| Purchase of treasury stock | ¥-10.0 billion | Parent only |
| Provision of allowance for doubtful accounts | ¥0.2 billion | Parent only |
| Provision of allowance for doubtful accounts | ¥2.0 billion | Parent only |
| Provision for loss on business of subsidiaries and associates | ¥1.4 billion | Parent only |
| Dividends from subsidiaries and associates | ¥9.8 billion | Parent only |
Statement of changes in equity (4 items)
| Item | Value | Consolidated / Non-consolidated |
|---|---|---|
| Total changes during the period | ¥40.1 billion | Consolidated |
| Net changes in items other than shareholders' equity | ¥7.3 billion | Consolidated |
| Total changes during the period | ¥-12.4 billion | Parent only |
| Net changes in items other than shareholders' equity | ¥0.4 billion | Parent only |
Statement of cash flows (37 items)
| Item | Value | Consolidated / Non-consolidated |
|---|---|---|
| Other | ¥-0.4 billion | Consolidated |
| Other | ¥-0.1 billion | Consolidated |
| Repayments of lease obligations | ¥-1.4 billion | Consolidated |
| Increase decrease in notes and accounts payable trade | ¥2.6 billion | Consolidated |
| Interest expenses paid | ¥-0.2 billion | Consolidated |
| Interest and dividends income received | ¥6.5 billion | Consolidated |
| Interest and dividend income | ¥-6.2 billion | Consolidated |
| Loss (gain) on sales of fixed assets | ¥0 | Consolidated |
| Loss on retirement of non-current assets | ¥0.3 billion | Consolidated |
| Decrease increase in notes and accounts receivable trade | ¥-2.1 billion | Consolidated |
| Proceeds from withdrawal of time deposits | ¥0.3 billion | Consolidated |
| Payments into time deposits | ¥-0.9 billion | Consolidated |
| Subtotal | ¥81.0 billion | Consolidated |
| Proceeds from redemption of investment securities | ¥1.7 billion | Consolidated |
| Purchase of investment securities | ¥-107.5 billion | Consolidated |
| Proceeds from sales of investment securities | ¥8.7 billion | Consolidated |
| Loss (gain) on sales of long-term investment securities | ¥-8.3 billion | Consolidated |
| Valuation gains (losses) on investment securities | ¥0.3 billion | Consolidated |
| Equity in earnings losses of affiliates | ¥-5.4 billion | Consolidated |
| Interest expenses | ¥0.2 billion | Consolidated |
| Proceeds from redemption of securities | ¥110.0 billion | Consolidated |
| Purchase of short term investment securities | ¥-30.0 billion | Consolidated |
| Purchase of property plant and equipment | ¥-6.8 billion | Consolidated |
| Proceeds from sales of property plant and equipment | ¥1.00 million | Consolidated |
| Income taxes paid | ¥-26.5 billion | Consolidated |
| Depreciation | ¥12.3 billion | Consolidated |
| Impairment loss | ¥3.2 billion | Consolidated |
| Purchase of intangible assets | ¥-3.3 billion | Consolidated |
| Decrease/increase in short-term loans payable | ¥1.2 billion | Consolidated |
| Proceeds from disposition of treasury stock | ¥1.2 billion | Consolidated |
| Regarding purchase of treasury stock | ¥-10.0 billion | Consolidated |
| Increase (decrease) in allowance for doubtful accounts | ¥-0.6 billion | Consolidated |
| Dividends | ¥-10.3 billion | Consolidated |
| Repayment of long term loans payable | ¥-1.2 billion | Consolidated |
| Payments of long-term loans receivable | ¥-0.3 billion | Consolidated |
| Collection of long-term loans receivable | ¥0.6 billion | Consolidated |
| Dividends paid to non-controlling interests | ¥-0.2 billion | Consolidated |
Basic indicators
| Item | Value | Consolidated / Non-consolidated | Source |
|---|---|---|---|
| Net cash provided by (used in) operating activities | ¥60.8 billion | Consolidated | Disclosed |
| Dividend per share | 45 | Parent only | Disclosed |
| Number of employees | 5,933 | Consolidated | Disclosed |
| Net assets | ¥1,031.1 billion | Consolidated | Disclosed |
| Net sales | ¥484.4 billion | Consolidated | Disclosed |
| Operating income | ¥69.3 billion | Consolidated | Disclosed |
| Operating revenue | ¥15.8 billion | Parent only | Disclosed |
| Ordinary income | ¥82.1 billion | Consolidated | Disclosed |
| Net income | ¥56.8 billion | Consolidated | Disclosed |
| Total assets | ¥1,282.6 billion | Consolidated | Disclosed |
| Operating margin | 14.3% | Consolidated | Calculated |
| Net margin | 11.7% | Consolidated | Calculated |
| Sales per employee | 81648070 yen | Consolidated | Calculated |
| Total asset turnover | 0.38 times | Consolidated | Calculated |
| Net assets to total assets | 80.4% | Consolidated | Calculated |