LY
LY Corporation
Company highlights
A company that split who pays into 5 groups instead of one.
Vol.6, Chapter 1 (as of 2026-08-26)
Key figures
Period Apr 2025 to Mar 2026ConsolidatedIFRS
Business revenue model
Featured in
Vol.6, Chapter 1 (as of 2026-08-26)
“Kaisha no Shikumi: Free”, Chapter 1: Google and LINE Yahoo: One Where Advertisers Pay 73.2%, One That Split the Payers Five Ways
Book’s reference date 2026-08-26 / data last checked 2026-10-20
Key points in this volumeA free service's profits depend not just on how many people use it, but on who pays.
100 million people a month use LINE free in Japan. For the year ended March 2026 revenue was ¥2,036.3 billion, and those who pay split into 5 groups: advertisers, companies with official accounts, monthly subscribers, merchants on its shopping sites, and shops that accept its payments.
In the same year that search advertising fell ¥20.8 billion to ¥179.0 billion, account advertising paid by companies rose ¥19.4 billion to ¥145.7 billion. PayPay handled ¥19,360.0 billion, of which 1.64% reaches the company.
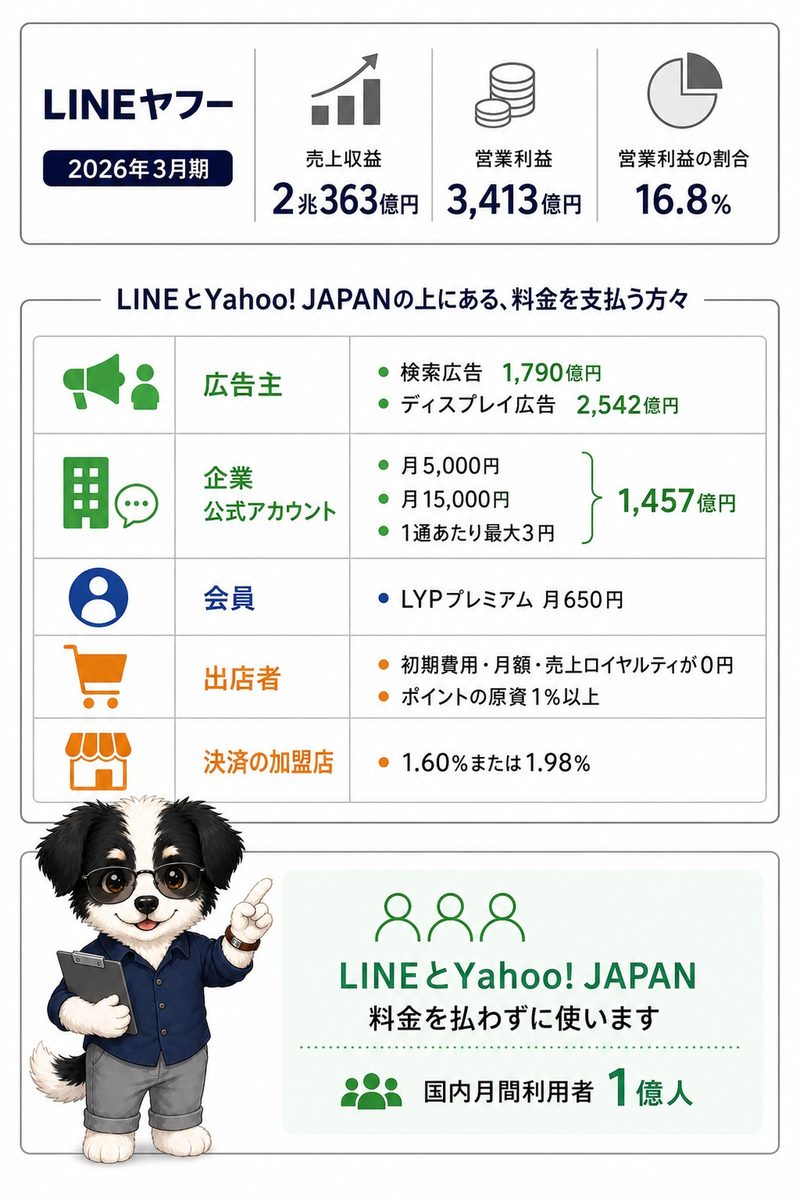
The move that changed LY Corporation
LY Corporation made PayPay a consolidated subsidiary, brought LINE and Yahoo into one company, and came to have payment revenue alongside advertising.
In October 2022 the company then called Z Holdings made PayPay a consolidated subsidiary. On October 1, 2023 the reorganisation of Z Holdings, LINE, Yahoo, and the rest was completed and LY Corporation was formed. In the year ended March 2026 PayPay's operating profit was ¥80.1 billion ($501 million) and Strategic was 21.9% of revenue. In the same year search advertising was ¥20.8 billion below the year before and account advertising ¥19.4 billion above it. Account advertising as a share of advertising revenue rose from 13.9% in the year ended March 2022 to 25.2% in the year ended March 2026.
Coverage in the book
- What LY Corporation Makes Its Money From
- There Are Five Payers
- PayPay, with Gross Merchandise Value of ¥19.36 Trillion
- LY Corporation's Ten Fiscal Years, and Its Dividend Policy
- In October 2022, PayPay Became a Consolidated Subsidiary
Related books, articles and videos
 “Kaisha no Shikumi: Free”
Chapter 1: LY
“Google and LINE Yahoo: One Where Advertisers Pay 73.2%, One That Split the Payers Five Ways”
“Ano Kaisha no Shikumi” series, Vol.6 — Kindle and paperback
Find it on Amazon →

Company profile
Tables scroll sideways
Disclosed data
Business activities and revenue composition
LY
Revenue and profit by business segment
Period Apr 2025 to Mar 2026Source Annual securities reportsConsolidated・Disclosed
| Business | Net sales to external customers | Operating income | |||||
|---|---|---|---|---|---|---|---|
| This year | Share | Last year | This year | Share | Margin | Last year | |
| Commerce | ¥854.9 billion | 42.2% | ¥846.3 billion | ¥87.4 billion | 23.8% | 10.2% | ¥104.2 billion |
| Media business | ¥729.3 billion | 36.0% | ¥724.9 billion | ¥210.8 billion | 57.5% | 28.9% | ¥219.0 billion |
| Strategy | ¥442.3 billion | 21.8% | ¥339.9 billion | ¥68.4 billion | 18.7% | 15.5% | ¥33.3 billion |
| Total of the businesses | ¥2,026.5 billion | 100.0% | ¥366.7 billion | 100.0% | |||
Revenue and profit
Amounts by account
| Group | Account | Amount | Consolidated / Non-consolidated |
|---|---|---|---|
| Selling, general and administrative expenses | Cost of sales | ¥1,751.0 billion | Consolidated |
| Selling general and administrative expenses IFRS | ¥1,220.9 billion | Consolidated | |
| Other | ¥200.5 billion | Parent only | |
| Depreciation | ¥147.9 billion | Parent only | |
| Promotion expenses | ¥126.8 billion | Parent only | |
| Business consignment expenses | ¥63.1 billion | Parent only | |
| Salaries and allowances | ¥59.1 billion | Parent only | |
| Taxes and dues | ¥7.0 billion | Parent only | |
| Share-based payment expenses | ¥2.6 billion | Parent only | |
| Profit by stage | Gross profit (loss) | ¥620.6 billion | Parent only |
| Operating income | ¥341.3 billion | Consolidated | |
| Net income | ¥193.7 billion | Consolidated | |
| Ordinary income | ¥167.3 billion | Parent only |
LY
Selling, general and administrative expenses
Period Apr 2025 to Mar 2026Source Annual securities reports
- Cost of sales ¥1,751.0 billion
- Selling general and administrative expenses IFRS ¥1,220.9 billion
- Other ¥200.5 billion
- Depreciation ¥147.9 billion
- Promotion expenses ¥126.8 billion
- Business consignment expenses ¥63.1 billion
Performance, financial position and capital allocation
Long-term changes in performance
LY
Long-term revenue, profit and asset trends
Period 2013 to 2026Source Annual securities reportsDisclosed
Recent performance trends
Year-on-year comparison
| Item | 2022 | 2023 | 2024 | 2025 | 2026 |
|---|---|---|---|---|---|
| Revenue (IFRS) | ¥1,567.4B | ¥1,672.4B | ¥1,814.7B | ¥1,917.5B | ¥2,036.4B |
| Year on year (%) | +30.0%◆ | +6.7% | +8.5% | +5.7% | +6.2% |
Fiscal periods marked for changes
Earlier fiscal periods (1)
- 2015Ordinary income (loss) as a share of revenue -2.4 points
- 2016Revenue (IFRS) year on year +52.2%
- 2017Revenue (IFRS) year on year +30.9%
- 2022Revenue (IFRS) year on year +30.0%
LY
Earnings and net assets per share over time
Unit yenSource Annual securities reports
Consolidated indicators (15 items)
| Item | 4 years ago | 3 years ago | 2 years ago | Last year | This year |
|---|---|---|---|---|---|
| Revenue (IFRS) | ¥1,567.4 billion | ¥1,672.4 billion | ¥1,814.7 billion | ¥1,917.5 billion | ¥2,036.4 billion |
| Profit (loss) (IFRS) | ¥91.6 billion | ¥189.2 billion | ¥139.1 billion | ¥202.4 billion | ¥283.1 billion |
| Profit (loss) attributable to owners of parent (IFRS) | ¥77.3 billion | ¥178.9 billion | ¥113.2 billion | ¥153.5 billion | ¥193.7 billion |
| Comprehensive income attributable to owners of parent (IFRS) | ¥107.0 billion | ¥276.5 billion | ¥144.3 billion | ¥123.4 billion | ¥219.9 billion |
| Equity attributable to owners of parent (IFRS) | ¥2,684.4 billion | ¥2,919.4 billion | ¥3,037.1 billion | ¥2,998.2 billion | ¥2,998.8 billion |
| Total assets (IFRS) | ¥7,110.4 billion | ¥8,588.7 billion | ¥9,044.0 billion | ¥9,158.3 billion | ¥11,205.2 billion |
| Equity attributable to owners of parent per share (IFRS) | 358.25 yen | 389.43 yen | 404.89 yen | 420.77 yen | 437.23 yen |
| Basic earnings (loss) per share (IFRS) | 10.2 yen | 23.87 yen | 15.1 yen | 21 yen | 27.97 yen |
| Diluted earnings (loss) per share (IFRS) | 10.14 yen | 23.8 yen | 15.04 yen | 20.92 yen | 27.85 yen |
| Ratio of equity attributable to owners of parent (IFRS) | 37.8% | 34.0% | 33.6% | 32.7% | 26.8% |
| Return on equity attributable to owners of parent (IFRS) | 2.9% | 6.4% | 3.8% | 5.1% | 6.5% |
| Net cash provided by (used in) operating activities (IFRS) | ¥266.3 billion | ¥93.1 billion | ¥316.5 billion | ¥519.6 billion | ¥662.9 billion |
| Net cash provided by (used in) investing activities (IFRS) | ¥-303.9 billion | ¥319.8 billion | ¥-444.1 billion | ¥-505.6 billion | ¥-809.2 billion |
| Net cash provided by (used in) financing activities (IFRS) | ¥91.6 billion | ¥105.8 billion | ¥-81.5 billion | ¥-416.8 billion | ¥153.3 billion |
| Cash and cash equivalents (IFRS) | ¥1,127.5 billion | ¥1,651.9 billion | ¥1,420.4 billion | ¥1,043.9 billion | ¥1,068.0 billion |
Parent only indicators (14 items)
| Item | 4 years ago | 3 years ago | 2 years ago | Last year | This year |
|---|---|---|---|---|---|
| Net sales | ¥92.3 billion | ¥53.3 billion | ¥378.2 billion | ¥763.2 billion | ¥769.5 billion |
| Ordinary income (loss) | ¥62.5 billion | ¥20.3 billion | ¥78.3 billion | ¥65.8 billion | ¥167.3 billion |
| Net income (loss) | ¥55.8 billion | ¥19.4 billion | ¥11.3 billion | ¥38.3 billion | ¥165.6 billion |
| Capital stock | ¥238.0 billion | ¥247.1 billion | ¥248.1 billion | ¥250.1 billion | ¥252.1 billion |
| Total number of issued shares (common stock) | 7,596,161,000 shares | 7,633,501,000 shares | 7,637,068,000 shares | 7,154,182,000 shares | 6,884,244,000 shares |
| Net assets | ¥2,338.0 billion | ¥2,345.7 billion | ¥2,347.4 billion | ¥2,200.8 billion | ¥2,231.0 billion |
| Total assets | ¥3,547.7 billion | ¥3,500.9 billion | ¥3,919.4 billion | ¥3,786.3 billion | ¥3,782.6 billion |
| Net assets per share | 309.95 yen | 307.53 yen | 307.94 yen | 303.19 yen | 319.46 yen |
| Dividend per share | 5.81 yen | 5.56 yen | 5.56 yen | 7 yen | 7.3 yen |
| Basic earnings (loss) per share | 7.36 yen | 2.58 yen | 1.51 yen | 5.24 yen | 23.91 yen |
| Diluted earnings per share | 7.31 yen | 2.58 yen | 1.5 yen | 5.22 yen | 23.86 yen |
| Equity-to-asset ratio | 65.5% | 66.1% | 58.9% | 57.1% | 57.9% |
| Return on equity | 2.4% | 0.8% | 0.5% | 1.7% | 7.6% |
| Payout ratio | 78.9% | 215.5% | 368.2% | 133.6% | 30.5% |
Dividend history
| Fiscal year | Annual dividend per share | Of which interim | Payout ratio (as reported, parent only) | Flag |
|---|---|---|---|---|
| FY ending 3/2026 | ¥7.3 | Could not be retrieved | 30.5% | |
| FY ending 3/2025 | ¥7 | Could not be retrieved | 133.6% | |
| FY ending 3/2024 | ¥5.56 | Could not be retrieved | 368.2% | |
| FY ending 3/2023 | ¥5.56 | Could not be retrieved | 215.5% | |
| FY ending 3/2022 | ¥5.81 | Could not be retrieved | 78.9% | |
| FY ending 3/2021 | ¥5.56 | Could not be retrieved | 712.8% | |
| FY ending 3/2020 | ¥8.86 | Could not be retrieved | 141.3% | |
| FY ending 3/2019 | ¥8.86 | Could not be retrieved | 51.5% | |
| FY ending 3/2018 | ¥8.86 | Could not be retrieved | 39.9% | |
| FY ending 3/2017 | ¥8.86 | Could not be retrieved | 37.4% | |
| FY ending 3/2016 | ¥8.86 | Could not be retrieved | 43.9% | |
| FY ending 3/2015 | ¥8.86 | Could not be retrieved | 42.4% | |
| FY ending 3/2014 | ¥4.43 | Could not be retrieved | 21.2% | Stock split or share consolidation noted |
| FY ending 3/2013 | ¥401 | Could not be retrieved | 20.6% |
LY
Dividends per share over time
Unit yenSource Annual securities reports
Shareholder composition
Share ownership by holder category
LY
Unit %Source Annual securities reports
- Financial institutions9.70%
- Securities firms2.10%
- Other corporations62.70%
- Foreign holders (institutions)21.00%
- Foreign holders (individuals)0.00%
- Individuals and others4.50%
- Government and municipalities0.00%
Research and development expenses and capital expenditure
| Fiscal year | Research and development | Capital expenditure |
|---|---|---|
| FY ending 3/2026 | ¥48.2 billion | ¥173.8 billion |
| FY ending 3/2021 | ¥2.8 billion | ¥94.5 billion |
Revenue scale in the same industry
LY
Source Annual securities reports of each company
Information and Communication: 642 companies · revenue · largest first・each company’s latest fiscal year・Consolidated・Disclosed
- 1 NTTFY Mar 2026 ¥14.4T
- 2 SoftBank GroupFY Mar 2026 ¥7.8T
- 3 ソフトバンクFY Mar 2026 ¥7.0T
- 4 KDDIFY Mar 2026 ¥6.1T
- 5 NTT DATA GROUPFY Mar 2025 ¥4.6T
- 6 LYThis companyFY Mar 2026 ¥2.0T
- 7 OTSUKAFY Dec 2025 ¥1.3T
- 8 Nomura Research InstituteFY Mar 2026 ¥814.7B
- … 634 companies
Workforce information
Women 3,687 Employees by gender
Administrative filings and published information
Workplace information filings
| Item | Value |
|---|---|
| Employees | 11,136 |
| Annual paid leave taken (all employees) | 87.4% |
| Share of managers who are women | 18.6% |
Greenhouse gas emissions
| Category | Emissions |
|---|---|
| 特定事業所排出者 | 225,816 t-CO2 |
| Sites covered by the report | 8 |
Audit and disclosure information
| Item | Value |
|---|---|
| Audit firm | 有限責任監査法人トーマツ |
| Audit fees (this year, total) | ¥3.2 billion |
| Non-audit fees (this year, total) | ¥0.3 billion |
| Audit fees (this year, network firms) | ¥0.3 billion |
| Non-audit fees (this year, network firms) | ¥28.00 million |
| Going concern note | Cannot be determined |
| Accounting standard | IFRS |
Sources and methodology
Retrieved disclosed figures
Major management indicators (5 years) (29 items)
| Item | Value | Consolidated / Non-consolidated |
|---|---|---|
| Net cash provided by (used in) operating activities (IFRS) | ¥662.9 billion | Consolidated |
| Basic earnings (loss) per share (IFRS) | 27.97 yen | Consolidated |
| Revenue (IFRS) | ¥2,036.4 billion | Consolidated |
| Diluted earnings (loss) per share (IFRS) | 27.85 yen | Consolidated |
| Profit (loss) (IFRS) | ¥283.1 billion | Consolidated |
| Profit (loss) attributable to owners of parent (IFRS) | ¥193.7 billion | Consolidated |
| Comprehensive income attributable to owners of parent (IFRS) | ¥219.9 billion | Consolidated |
| Net cash provided by (used in) investing activities (IFRS) | ¥-809.2 billion | Consolidated |
| Cash and cash equivalents (IFRS) | ¥1,068.0 billion | Consolidated |
| Total assets (IFRS) | ¥11,205.2 billion | Consolidated |
| Equity attributable to owners of parent (IFRS) | ¥2,998.8 billion | Consolidated |
| Return on equity attributable to owners of parent (IFRS) | 6.5% | Consolidated |
| Ratio of equity attributable to owners of parent (IFRS) | 26.8% | Consolidated |
| Net cash provided by (used in) financing activities (IFRS) | ¥153.3 billion | Consolidated |
| Equity attributable to owners of parent per share (IFRS) | 437.23 yen | Consolidated |
| Dividend per share | 7.3 yen | Parent only |
| Net sales | ¥769.5 billion | Parent only |
| Net income (loss) | ¥165.6 billion | Parent only |
| Diluted earnings per share | 23.86 yen | Parent only |
| Total number of issued shares (common stock) | 6,884,244,000 shares | Parent only |
| Net assets | ¥2,231.0 billion | Parent only |
| Ordinary income (loss) | ¥167.3 billion | Parent only |
| Total assets | ¥3,782.6 billion | Parent only |
| Return on equity | 7.6% | Parent only |
| Equity-to-asset ratio | 57.9% | Parent only |
| Capital stock | ¥252.1 billion | Parent only |
| Payout ratio | 30.5% | Parent only |
| Basic earnings (loss) per share | 23.91 yen | Parent only |
| Net assets per share | 319.46 yen | Parent only |
Accounts unique to this company (48 items)
| Item | Value | Consolidated / Non-consolidated |
|---|---|---|
| Revenue | ¥341.3 billion | Consolidated |
| Revenue | 29,863 | Consolidated |
| Revenue | 11,490 | Consolidated |
| Revenue | ¥52.8 billion | Consolidated |
| Revenue | ¥32.3 billion | Consolidated |
| Revenue | ¥1,252.9 billion | Consolidated |
| Revenue | ¥1,550.8 billion | Consolidated |
| Revenue | ¥1,616.0 billion | Consolidated |
| Revenue | ¥2,701.2 billion | Consolidated |
| Revenue | ¥5.5 billion | Consolidated |
| Revenue | ¥7.9 billion | Consolidated |
| Revenue | ¥38.7 billion | Consolidated |
| Revenue | ¥19.6 billion | Consolidated |
| Revenue | ¥10.8 billion | Consolidated |
| Revenue | ¥-3.2 billion | Consolidated |
| Revenue | ¥0.6 billion | Consolidated |
| Revenue | ¥-3.1 billion | Consolidated |
| Revenue | ¥29.3 billion | Consolidated |
| Revenue | ¥1.8 billion | Consolidated |
| Revenue | ¥4.9 billion | Consolidated |
| Revenue | ¥-61.4 billion | Consolidated |
| Revenue | ¥5.5 billion | Consolidated |
| Revenue | ¥19.6 billion | Consolidated |
| Revenue | ¥-10.8 billion | Consolidated |
| Revenue | ¥26.2 billion | Consolidated |
| Revenue | ¥-271.3 billion | Consolidated |
| Revenue | ¥-362.9 billion | Consolidated |
| Revenue | ¥488.6 billion | Consolidated |
| Revenue | ¥-833.6 billion | Consolidated |
| Revenue | ¥251.4 billion | Consolidated |
| Revenue | ¥-14.8 billion | Consolidated |
| Revenue | ¥685.5 billion | Consolidated |
| Revenue | ¥-720.5 billion | Consolidated |
| Revenue | ¥7.9 billion | Consolidated |
| Revenue | ¥38.7 billion | Consolidated |
| Revenue | ¥19.6 billion | Consolidated |
| Revenue | ¥10.8 billion | Consolidated |
| Revenue | ¥481.0 billion | Consolidated |
| Revenue | ¥724.8 billion | Consolidated |
| Revenue | ¥-243.8 billion | Consolidated |
| Revenue | ¥176.4 billion | Consolidated |
| Revenue | ¥61.4 billion | Consolidated |
| Change in average annual salary from the previous year | 2.0% | Parent only |
| Revenue | ¥163.8 billion | Parent only |
| Revenue | ¥2.7 billion | Parent only |
| Revenue | ¥2.1 billion | Parent only |
| Revenue | ¥2.0 billion | Parent only |
| Revenue | ¥57.6 billion | Parent only |
Employees (10 items)
| Item | Value | Consolidated / Non-consolidated |
|---|---|---|
| Number of employees | 29,863 people | Consolidated |
| Wage gap between men and women (all employees) | 79.5% | Parent only |
| Average length of service (years) | 9.6 years | Parent only |
| Average annual salary | ¥9.02 million | Parent only |
| Average age (years) | 39 years old | Parent only |
| Number of employees | 10,577 people | Parent only |
| Number of employees | 10,577 people | Parent only |
| Number of employees | 10,577 people | Parent only |
| Wage gap between men and women (regular employees) | 80.4% | Parent only |
| Wage gap between men and women (non-regular employees) | 79.0% | Parent only |
Shares (16 items)
| Item | Value | Consolidated / Non-consolidated |
|---|---|---|
| Number of shares held | 5,278,391,125 shares | Consolidated |
| Total number of shares held treasury shares etc | 5,439,700 shares | Consolidated |
| Number of issues whose number of shares decreased shares not listed investment shares held for purposes other than pure investment reporting company | 1 issues | Consolidated |
| Number of issues whose number of shares decreased shares other than those not listed investment shares held for purposes other than pure investment reporting company | 1 issues | Consolidated |
| Total sale amount for decreased shares shares not listed investment shares held for purposes other than pure investment reporting company | ¥0 | Consolidated |
| Total sale amount for decreased shares shares other than those not listed investment shares held for purposes other than pure investment reporting company | ¥0.5 billion | Consolidated |
| Number of shares | 6,884,244,856 shares | Consolidated |
| Shareholding ratio treasury shares etc | 0.1% | Consolidated |
| Shareholding ratio | 76.7% | Consolidated |
| Number of shares held in own name treasury shares etc | 5,439,700 shares | Consolidated |
| Number of voting rights | 68,779,567 units | Consolidated |
| Carrying amount on the balance sheet | ¥1.9 billion | Consolidated |
| Carrying amount on the balance sheet | ¥2.9 billion | Consolidated |
| Number of issues | 12 issues | Consolidated |
| Number of issues | 4 issues | Consolidated |
| Total shareholder return | 75.2% | Parent only |
Other disclosed items (4 items)
| Item | Value | Consolidated / Non-consolidated |
|---|---|---|
| Average number of temporary employees | 11,490 people | Consolidated |
| Total return on the share price index | 202.2% | Parent only |
| Rate of male employees taking childcare leave (regular employees) | 100.0% | Parent only |
| Ratio of female employees in managerial positions | 18.6% | Parent only |
Research and development (1 items)
| Item | Value | Consolidated / Non-consolidated |
|---|---|---|
| Research and development expenses | ¥48.2 billion | Consolidated |
Property and facilities (1 items)
| Item | Value | Consolidated / Non-consolidated |
|---|---|---|
| Capital expenditures | ¥173.8 billion | Consolidated |
Audit (10 items)
| Item | Value | Consolidated / Non-consolidated |
|---|---|---|
| Fees for audit and attestation services - reporting company | ¥0.6 billion | Consolidated |
| Fees for audit and attestation services - total | ¥0.3 billion | Consolidated |
| Fees for audit and attestation services - total | ¥3.2 billion | Consolidated |
| Fees for audit and attestation services - consolidated subsidiaries | ¥0.3 billion | Consolidated |
| Fees for audit and attestation services - consolidated subsidiaries | ¥2.6 billion | Consolidated |
| Fees for non-audit services - reporting company | ¥64.00 million | Consolidated |
| Fees for non-audit services - total | ¥28.00 million | Consolidated |
| Fees for non-audit services - total | ¥0.3 billion | Consolidated |
| Non audit fees consolidated subsidiaries network firms | ¥28.00 million | Consolidated |
| Non audit fees consolidated subsidiaries | ¥0.2 billion | Consolidated |
Balance sheet (128 items)
| Item | Value | Consolidated / Non-consolidated |
|---|---|---|
| Other | ¥20.3 billion | Consolidated |
| Other | ¥-10.5 billion | Consolidated |
| Other | ¥9.8 billion | Consolidated |
| Other | ¥-10.8 billion | Consolidated |
| Other | ¥17.1 billion | Consolidated |
| Other | ¥6.3 billion | Consolidated |
| Accumulated other comprehensive income IFRS | ¥64.3 billion | Consolidated |
| Other current liabilities | ¥245.5 billion | Consolidated |
| Other current assets | ¥107.5 billion | Consolidated |
| Other financial liabilities | ¥92.3 billion | Consolidated |
| Other financial assets | ¥714.7 billion | Consolidated |
| Goodwill | ¥2,191.7 billion | Consolidated |
| Goodwill IFRS | ¥2,191.7 billion | Consolidated |
| Goodwill IFRS | ¥2,191.7 billion | Consolidated |
| Software | ¥-313.3 billion | Consolidated |
| Software | ¥541.5 billion | Consolidated |
| Software IFRS | ¥228.2 billion | Consolidated |
| Right of use assets IFRS | ¥198.0 billion | Consolidated |
| Retained earnings IFRS | ¥996.1 billion | Consolidated |
| Trademarks acquisition cost IFRS | ¥594.2 billion | Consolidated |
| Trademarks IFRS | ¥594.2 billion | Consolidated |
| Trade and other payables liabilities IFRS | ¥2,218.5 billion | Consolidated |
| Trade and other receivables assets IFRS | ¥539.4 billion | Consolidated |
| Land | ¥2.1 billion | Consolidated |
| Land IFRS | ¥2.1 billion | Consolidated |
| Tools, furniture and fixtures | ¥294.2 billion | Consolidated |
| Tools, furniture and fixtures | ¥-181.2 billion | Consolidated |
| Tools, furniture and fixtures | ¥113.0 billion | Consolidated |
| Buildings and structures | ¥139.0 billion | Consolidated |
| Buildings and structures | ¥-46.6 billion | Consolidated |
| Buildings and structures IFRS | ¥92.4 billion | Consolidated |
| Construction in progress | ¥10.7 billion | Consolidated |
| Construction in progress IFRS | ¥10.7 billion | Consolidated |
| Provisions liabilities IFRS | ¥37.2 billion | Consolidated |
| Investments accounted for using equity method IFRS | ¥192.3 billion | Consolidated |
| Interest bearing liabilities liabilities IFRS | ¥1,962.0 billion | Consolidated |
| Property, plant and equipment | ¥525.8 billion | Consolidated |
| Property, plant and equipment | ¥-266.2 billion | Consolidated |
| Property plant and equipment IFRS | ¥259.6 billion | Consolidated |
| Property plant and equipment IFRS | ¥259.6 billion | Consolidated |
| Income taxes payable | ¥43.1 billion | Consolidated |
| Machinery, equipment and vehicles | ¥59.5 billion | Consolidated |
| Machinery, equipment and vehicles | ¥-27.8 billion | Consolidated |
| Machinery and vehicles IFRS | ¥31.7 billion | Consolidated |
| Intangible assets accumulated amortization and impairment losses IFRS | ¥-568.0 billion | Consolidated |
| Intangible assets acquisition cost IFRS | ¥1,877.6 billion | Consolidated |
| Intangible assets IFRS | ¥1,309.7 billion | Consolidated |
| Intangible assets IFRS | ¥1,309.7 billion | Consolidated |
| Cash and cash equivalents (IFRS) | ¥1,068.0 billion | Consolidated |
| Cash and cash equivalents (IFRS) | ¥1,068.0 billion | Consolidated |
| Net assets | ¥3,713.5 billion | Consolidated |
| Net assets | ¥3,713.5 billion | Consolidated |
| Total assets | ¥11,205.2 billion | Consolidated |
| Deferred tax liabilities IFRS | ¥191.9 billion | Consolidated |
| Deferred tax assets IFRS | ¥119.5 billion | Consolidated |
| Treasury shares IFRS | ¥-13.3 billion | Consolidated |
| Equity attributable to owners of parent (IFRS) | ¥2,998.8 billion | Consolidated |
| Liabilities and equity IFRS | ¥11,205.2 billion | Consolidated |
| Liabilities IFRS | ¥7,491.7 billion | Consolidated |
| Capital surplus IFRS | ¥1,699.6 billion | Consolidated |
| Share capital IFRS | ¥252.1 billion | Consolidated |
| Non controlling interests IFRS | ¥714.7 billion | Consolidated |
| Other | ¥8.7 billion | Parent only |
| Other | ¥14.3 billion | Parent only |
| Other | ¥26.5 billion | Parent only |
| Other | ¥24.3 billion | Parent only |
| Other | ¥41.00 million | Parent only |
| Investments in other securities of subsidiaries and associates | ¥96.1 billion | Parent only |
| Valuation difference on available-for-sale securities | ¥10.5 billion | Parent only |
| Other capital surplus | ¥1,445.9 billion | Parent only |
| Other, net | ¥1.1 billion | Parent only |
| Goodwill | ¥753.7 billion | Parent only |
| Software | ¥106.5 billion | Parent only |
| Software in progress | ¥18.7 billion | Parent only |
| Lease obligations | ¥41.2 billion | Parent only |
| Lease obligations | ¥23.5 billion | Parent only |
| Retained earnings | ¥248.6 billion | Parent only |
| Legal retained earnings | ¥27.00 million | Parent only |
| Prepaid expenses | ¥16.2 billion | Parent only |
| Right of trademark | ¥170.6 billion | Parent only |
| Non-current liabilities | ¥799.9 billion | Parent only |
| Non-current assets | ¥3,190.0 billion | Parent only |
| Land | ¥1.1 billion | Parent only |
| Accounts receivable - trade | ¥101.2 billion | Parent only |
| Contract liabilities | ¥41.8 billion | Parent only |
| Tools, furniture and fixtures | ¥81.8 billion | Parent only |
| Buildings, net | ¥62.0 billion | Parent only |
| Investments and other assets | ¥1,803.1 billion | Parent only |
| Investment securities | ¥13.6 billion | Parent only |
| Subscription rights to shares | ¥40.0 billion | Parent only |
| Property, plant and equipment | ¥173.6 billion | Parent only |
| Accounts receivable - other | ¥183.8 billion | Parent only |
| Income taxes payable | ¥2.0 billion | Parent only |
| Accrued expenses | ¥3.3 billion | Parent only |
| Accounts payable - other | ¥275.9 billion | Parent only |
| Shareholders' equity | ¥2,180.5 billion | Parent only |
| Machinery and equipment, net | ¥27.6 billion | Parent only |
| Current liabilities | ¥751.7 billion | Parent only |
| Current assets | ¥592.6 billion | Parent only |
| Intangible assets | ¥1,213.3 billion | Parent only |
| Cash and deposits | ¥260.7 billion | Parent only |
| Short-term loans payable | ¥72.3 billion | Parent only |
| Bonds payable | ¥355.0 billion | Parent only |
| Net assets | ¥2,231.0 billion | Parent only |
| Net assets | ¥2,231.0 billion | Parent only |
| Total assets | ¥3,782.6 billion | Parent only |
| Deferred tax assets | ¥19.5 billion | Parent only |
| Retained earnings brought forward | ¥248.6 billion | Parent only |
| Treasury stock | ¥-13.3 billion | Parent only |
| Valuation and translation adjustments | ¥10.5 billion | Parent only |
| Liabilities | ¥1,551.6 billion | Parent only |
| Liabilities and net assets | ¥3,782.6 billion | Parent only |
| Accounts payable - trade | ¥29.9 billion | Parent only |
| Allowance for doubtful accounts | ¥-2.9 billion | Parent only |
| Allowance for doubtful accounts | ¥-3.0 billion | Parent only |
| Capital surplus | ¥1,693.1 billion | Parent only |
| Legal capital surplus | ¥247.2 billion | Parent only |
| Capital stock | ¥252.1 billion | Parent only |
| Asset retirement obligations | ¥10.1 billion | Parent only |
| Asset retirement obligations | ¥87.00 million | Parent only |
| Long-term loans payable | ¥382.7 billion | Parent only |
| Long-term prepaid expenses | ¥4.7 billion | Parent only |
| Shares of subsidiaries and associates | ¥1,626.8 billion | Parent only |
| Loans receivable to subsidiaries and affiliates | ¥9.3 billion | Parent only |
| Long-term loans receivable from subsidiaries and affiliates | ¥31.1 billion | Parent only |
| Deposits received | ¥67.8 billion | Parent only |
| Current portion of bonds payable | ¥120.0 billion | Parent only |
| Current portion of long-term loans payable | ¥86.0 billion | Parent only |
Statement of income (95 items)
| Item | Value | Consolidated / Non-consolidated |
|---|---|---|
| Other | ¥315.3 billion | Consolidated |
| Other | ¥3.7 billion | Consolidated |
| Other comprehensive income IFRS | ¥29.7 billion | Consolidated |
| Other comprehensive income IFRS | ¥29.7 billion | Consolidated |
| Personnel expenses | ¥304.7 billion | Consolidated |
| Gain on remeasurement relating to business combinations IFRS | ¥61.4 billion | Consolidated |
| Cost of goods sold IFRS | ¥320.1 billion | Consolidated |
| Operating income | ¥341.3 billion | Consolidated |
| Operating income | ¥341.3 billion | Consolidated |
| Net cash provided by (used in) operating activities | ¥662.9 billion | Consolidated |
| Exchange differences on translation of foreign operations net of tax items that may be reclassified to profit or loss ociifrs | ¥31.4 billion | Consolidated |
| Basic earnings loss per share IFRS | 27.97 yen | Consolidated |
| Cost of sales | ¥1,751.0 billion | Consolidated |
| Cost of sales IFRS | ¥530.1 billion | Consolidated |
| Net sales | ¥2,036.4 billion | Consolidated |
| Net sales | ¥2,036.4 billion | Consolidated |
| Revenue from external customers IFRS | ¥2,036.4 billion | Consolidated |
| Diluted earnings loss per share IFRS | 27.85 yen | Consolidated |
| Profit loss IFRS | ¥283.1 billion | Consolidated |
| Profit loss IFRS | ¥283.1 billion | Consolidated |
| Profit loss IFRS | ¥283.1 billion | Consolidated |
| Profit loss IFRS | ¥283.1 billion | Consolidated |
| Comprehensive income (IFRS) | ¥312.8 billion | Consolidated |
| Comprehensive income (IFRS) | ¥312.8 billion | Consolidated |
| Comprehensive income (IFRS) | ¥312.8 billion | Consolidated |
| Net income | ¥193.7 billion | Consolidated |
| Total transactions with owners IFRS | ¥-18.2 billion | Consolidated |
| Net cash provided by (used in) investing activities (IFRS) | ¥-809.2 billion | Consolidated |
| Share of profit loss of investments accounted for using equity method IFRS | ¥-7.5 billion | Consolidated |
| Share of profit loss of investments accounted for using equity method IFRS | ¥-7.5 billion | Consolidated |
| Commission fees | ¥130.3 billion | Consolidated |
| Change in interests in subsidiaries | ¥158.7 billion | Consolidated |
| Issuance of new shares ssifrs | ¥4.5 billion | Consolidated |
| Business consignment expenses | ¥154.4 billion | Consolidated |
| Income tax expense IFRS | ¥11.1 billion | Consolidated |
| Depreciation and amortization | ¥176.4 billion | Consolidated |
| Net increase decrease in cash and cash equivalents IFRS | ¥24.1 billion | Consolidated |
| Effect of exchange rate changes on cash and cash equivalents IFRS | ¥17.2 billion | Consolidated |
| Remeasurements of defined benefit plans net of tax items that will not be reclassified to profit or loss ociifrs | ¥4.0 billion | Consolidated |
| Total of items that will not be reclassified to profit or loss ociifrs | ¥1.4 billion | Consolidated |
| Total of items that may be reclassified to profit or loss ociifrs | ¥28.2 billion | Consolidated |
| Profit loss before tax IFRS | ¥294.2 billion | Consolidated |
| Profit loss before tax IFRS | ¥294.2 billion | Consolidated |
| Profit loss before tax IFRS | ¥294.2 billion | Consolidated |
| Purchase of treasury stock | ¥-148.6 billion | Consolidated |
| Packing and transportation expenses IFRS | ¥87.2 billion | Consolidated |
| Comprehensive income attributable to owners of parent IFRS | ¥219.9 billion | Consolidated |
| Net cash provided by (used in) financing activities (IFRS) | ¥153.3 billion | Consolidated |
| Sales promotion expenses IFRS | ¥201.0 billion | Consolidated |
| Selling general and administrative expenses IFRS | ¥1,220.9 billion | Consolidated |
| Dividendsofsurplus | ¥-67.7 billion | Consolidated |
| Profit loss attributable to non controlling interests IFRS | ¥89.4 billion | Consolidated |
| Comprehensive income attributable to non controlling interests IFRS | ¥92.8 billion | Consolidated |
| Other | ¥6.4 billion | Parent only |
| Other | ¥2.9 billion | Parent only |
| Other | ¥3.0 billion | Parent only |
| Other | ¥2.3 billion | Parent only |
| Other | ¥200.5 billion | Parent only |
| Dividends from surplus | ¥-50.1 billion | Parent only |
| Interest income | ¥1.1 billion | Parent only |
| Dividend income | ¥165.7 billion | Parent only |
| Operating income | ¥13.4 billion | Parent only |
| Non-operating income | ¥173.2 billion | Parent only |
| Non-operating expenses | ¥19.4 billion | Parent only |
| Cost of sales | ¥148.9 billion | Parent only |
| Gross profit (loss) | ¥620.6 billion | Parent only |
| Net sales | ¥769.5 billion | Parent only |
| Net income (loss) | ¥165.6 billion | Parent only |
| Net income (loss) | ¥165.6 billion | Parent only |
| Gain on sales of investment securities | ¥0.5 billion | Parent only |
| Loss on valuation of investment securities | ¥0.1 billion | Parent only |
| Gain on extinguishment of tie-in shares | ¥13.7 billion | Parent only |
| Interest expenses | ¥10.8 billion | Parent only |
| Commission fees | ¥1.9 billion | Parent only |
| Issuance of new shares | ¥4.0 billion | Parent only |
| Share-based payment expenses | ¥2.6 billion | Parent only |
| Business consignment expenses | ¥63.1 billion | Parent only |
| Income taxes - current | ¥15.4 billion | Parent only |
| Income taxes | ¥5.0 billion | Parent only |
| Income taxes - deferred | ¥-10.4 billion | Parent only |
| Depreciation | ¥147.9 billion | Parent only |
| Impairment loss | ¥1.3 billion | Parent only |
| Extraordinary income | ¥19.2 billion | Parent only |
| Extraordinary loss | ¥15.9 billion | Parent only |
| Interest on bonds | ¥3.7 billion | Parent only |
| Taxes and dues | ¥7.0 billion | Parent only |
| Income (loss) before income taxes | ¥170.6 billion | Parent only |
| Ordinary income | ¥167.3 billion | Parent only |
| Salaries and allowances | ¥59.1 billion | Parent only |
| Disposal of treasury stock | ¥3.6 billion | Parent only |
| Purchase of treasury stock | ¥-148.6 billion | Parent only |
| Promotion expenses | ¥126.8 billion | Parent only |
| Selling, general and administrative expenses | ¥607.1 billion | Parent only |
| Provision of allowance for doubtful accounts | ¥32.00 million | Parent only |
| Loss on valuation of shares of subsidiaries and associates | ¥12.2 billion | Parent only |
Statement of cash flows (25 items)
| Item | Value | Consolidated / Non-consolidated |
|---|---|---|
| Other | ¥-334.3 billion | Consolidated |
| Other | ¥-23.7 billion | Consolidated |
| Other | ¥-32.6 billion | Consolidated |
| Proceeds from sale and leaseback transactions fin cfifrs | ¥13.0 billion | Consolidated |
| Repayments of lease obligations | ¥-40.9 billion | Consolidated |
| Interest paid ope cfifrs | ¥-21.8 billion | Consolidated |
| Interest and dividends received ope cfifrs | ¥6.1 billion | Consolidated |
| Increase (decrease) in trade and other payables | ¥321.4 billion | Consolidated |
| Decrease (increase) in trade and other receivables | ¥173.6 billion | Consolidated |
| Proceeds from withdrawal of time deposits inv cfifrs | ¥40.3 billion | Consolidated |
| Subtotal | ¥779.0 billion | Consolidated |
| Proceeds from sale of investments inv cfifrs | ¥66.8 billion | Consolidated |
| Share of loss profit of investments accounted for using equity method ope cfifrs | ¥7.5 billion | Consolidated |
| Income taxes paid ope cfifrs | ¥-103.9 billion | Consolidated |
| Income taxes refund ope cfifrs | ¥3.5 billion | Consolidated |
| Depreciation and amortization | ¥176.4 billion | Consolidated |
| Decrease/increase in short-term loans payable | ¥191.5 billion | Consolidated |
| Redemption of bonds fin cfifrs | ¥-70.0 billion | Consolidated |
| Proceeds from issuance of bonds fin cfifrs | ¥100.0 billion | Consolidated |
| Regarding purchase of treasury stock | ¥-148.7 billion | Consolidated |
| Dividends | ¥-49.9 billion | Consolidated |
| Proceeds from long term borrowings fin cfifrs | ¥179.2 billion | Consolidated |
| Repayments of long term borrowings fin cfifrs | ¥-113.0 billion | Consolidated |
| Capital contribution from non controlling interests fin cfifrs | ¥183.3 billion | Consolidated |
| Dividends paid to non controlling interests fin cfifrs | ¥-17.9 billion | Consolidated |
Statement of changes in equity (2 items)
| Item | Value | Consolidated / Non-consolidated |
|---|---|---|
| Total changes during the period | ¥30.2 billion | Parent only |
| Net changes in items other than shareholders' equity | ¥-2.0 billion | Parent only |
Basic indicators
| Item | Value | Consolidated / Non-consolidated | Source |
|---|---|---|---|
| Net cash provided by (used in) operating activities | ¥662.9 billion | Consolidated | Disclosed |
| Dividend per share | 7 | Parent only | Disclosed |
| Number of employees | 29,863 | Consolidated | Disclosed |
| Net assets | ¥3,713.5 billion | Consolidated | Disclosed |
| Net sales | ¥2,036.4 billion | Consolidated | Disclosed |
| Operating income | ¥341.3 billion | Consolidated | Disclosed |
| Ordinary income | ¥167.3 billion | Parent only | Disclosed |
| Net income | ¥193.7 billion | Consolidated | Disclosed |
| Total assets | ¥11,205.2 billion | Consolidated | Disclosed |
| Operating margin | 16.8% | Consolidated | Calculated |
| Net margin | 9.5% | Consolidated | Calculated |
| Sales per employee | 68190269 yen | Consolidated | Calculated |
| Total asset turnover | 0.18 times | Consolidated | Calculated |
| Net assets to total assets | 33.1% | Consolidated | Calculated |